
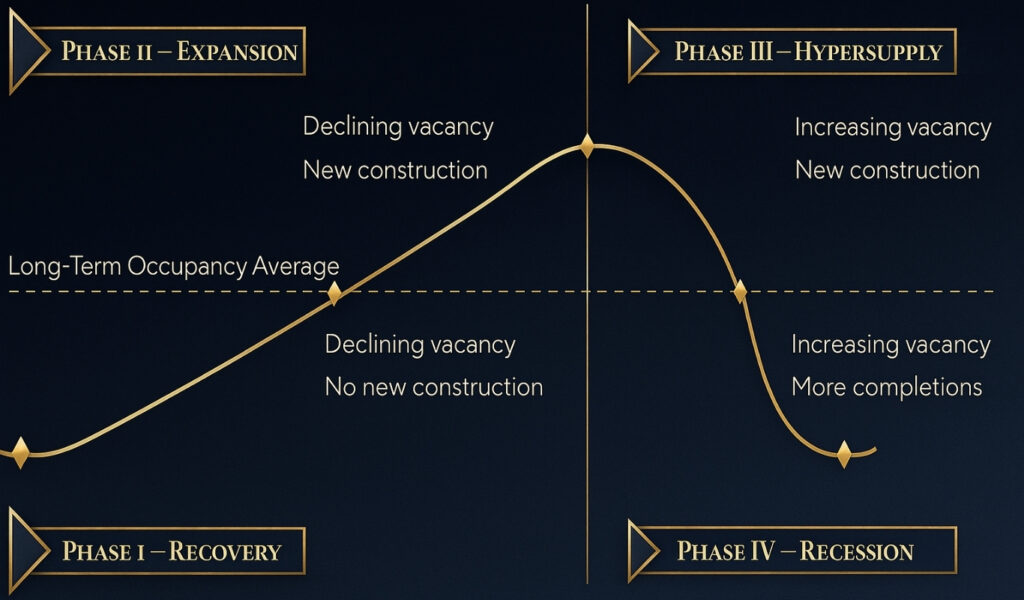
The real estate market moves in cycles, just like the broader economy. And if you understand the four distinct phases of that cycle — Recovery, Expansion, Hyper Supply, and Recession — you put yourself in a position to time acquisitions smarter, optimize your return on investment, and cut unnecessary risk.
These phases touch everything you care about as an investor. Property prices, rental yields, construction activity, vacancy rates, financing availability — all of it shifts depending on where you are in the cycle.
As of 2026, you’re operating in an environment shaped by elevated interest rates, regional gaps in vacancy rates, and shifting consumer confidence. In that context, knowing which phase your target market is in has become one of the most useful tools you can have, whether your focus is cash flow investing, value-add plays, or opportunistic acquisitions.
Each phase signals a different risk and reward profile, and each one moves the needle on a specific set of key indicators worth tracking closely.
- Net Operating Income (NOI) and Cap Rate Compression
- Property Absorption Rates and Rental Rate Growth
- Construction Starts and Building Permits
- Debt Service Coverage Ratios (DSCR) and Loan-to-Value Ratios (LTV)
These indicators don’t move in lockstep across all asset classes. Multi-family apartments might be deep in expansion while retail centers are still stuck in recession. You have to look at each sector on its own terms.
The same logic applies to strategy. Distressed property acquisition, stabilized core investing, and adaptive reuse each fit better in certain phases than others. A one-size-fits-all approach will rarely deliver consistent results across a full cycle.
What follows is a detailed, data-driven look at each phase of the real estate market cycle. You’ll find the economic signals to watch, how different asset classes tend to perform, and how savvy investors position themselves at each stage. If you want to go deeper on specific asset types, this breakdown of the best types of real estate to invest in is worth your time.
The goal is straightforward. You should finish this with the foresight to spot market transitions early and act on cyclical opportunities, whether that’s student housing, industrial properties, or short-term rentals like Airbnb.
Table of Contents
What Is A Real Estate Market Cycle?
A real estate market cycle is the recurring pattern of fluctuations that drives property values, rental demand, construction activity, and investor behavior. GDP growth, interest rates, unemployment, and demographic shifts all feed into it, and the cycle plays out across four key phases: Recovery, Expansion, Hyper Supply, and Recession.
Several macro and microeconomic metrics act as early warning signals, telling you which phase a market is entering before the headlines catch up.
- GDP Growth: Signals general economic health and demand for space across asset classes.
- Interest Rates: Higher rates increase borrowing costs, reducing transaction volume and cash flow investing opportunities.
- Vacancy Rate: Tracks available space. Rising vacancy typically precedes a downturn.
- Rental Rate Growth: Declining growth often indicates a shift from Expansion to Hyper Supply.
- Property Absorption Rate: Measures how quickly new inventory is leased or sold, offering insight into demand.
- Construction Starts and Building Permits: Surge during Expansion and taper off during Recession.
- Cap Rate Compression: Occurs when investor demand drives prices up, typically during late Expansion.
When you understand these metrics, you can align your financing, asset selection, and holding strategy with where the cycle actually is. During periods of cap rate compression and low operating expense ratios, for example, a buy-and-hold strategy in a stable market will typically outperform speculative land purchases.
Different property types also respond in very different ways to cyclical shifts. What works for multi-family in a recovery won’t necessarily work for office or retail in the same environment.
| Property Type | Typical Performance in Cycles |
|---|---|
| Single-Family Rentals | Strong in Recovery and Expansion |
| Multi-Family Apartments | Resilient across all cycles, particularly Recession |
| Commercial Office Buildings | Sensitive to GDP and employment trends |
| Industrial Properties | Performs well during Expansion |
| Retail Centers | Struggles during Recession and Hyper Supply |
| Student Housing | Defensive in downturns |
| Senior Living Facilities | Demographically driven; moderate volatility |
| Mobile Home Parks | Counter-cyclical, stable in downturns |
| Short-Term Rentals (Airbnb) | High in Expansion; volatile in downturns |
| Mixed-Use Developments | High returns but dependent on stable macroeconomic conditions |
By tracking both asset class behavior and the key metrics together, you can navigate the cycle with a lot more confidence and a lot fewer surprises.
Preferred equity might make sense during Expansion, but bridge financing or hard money loans often fit better in Recovery or Recession phases, when traditional lending tends to pull back. Knowing which tool to use and when is what separates disciplined investors from those who get caught off-guard.
1. Recovery
Recovery is where a new real estate market cycle begins, picking up after a downturn. Economic confidence is low, activity is slow, and new construction is almost nonexistent. But this is also where some of the highest long-term upside lives, for investors who know what they’re looking for and can handle near-term uncertainty.
Key Indicators in Recovery
- Vacancy Rates: Typically remain high but begin to stabilize.
- Rental Rate Growth: Flat or slightly positive after prior declines.
- GDP Growth: Slow but returning to positive territory.
- Unemployment Rate: Starts to decline gradually.
- Building Permits: Minimal, as developers wait for clearer signs of demand.
- Property Absorption Rates: Increase modestly, particularly in multi-family and industrial sectors.
The broader economy may still look shaky, but you’ll start to notice subtle shifts, things like rising consumer confidence or gradual improvements in leasing activity, that signal the market is quietly healing. Construction starts are rare at this stage, but existing properties begin to fill up. Class B and C apartments, single-family rentals, and mobile home parks tend to lead the way, driven by affordability and basic utility needs.
This is often called the “smart money” phase. The investors who build the most wealth in a cycle tend to buy here, before the crowd arrives and before prices reflect the recovery that’s already underway.
The best plays in Recovery tend to be distressed property acquisitions, value-add repositioning, and opportunistic purchases of undervalued assets with strong long-term fundamentals. You’re buying low and letting the cycle do the heavy lifting.
- Distressed Property Acquisition: Properties with deferred maintenance, low occupancy, or delinquent financing can be acquired below replacement cost.
- Value-Add Strategy: Investors reposition assets through renovations or operational improvements to increase Net Operating Income (NOI) and prepare for appreciation
- Opportunistic Investing: High-risk, high-reward acquisitions in emerging submarkets that are first to recover.
- Adaptive Reuse: Converting underperforming commercial space into multi-family apartments or senior living facilities to meet shifting demand.
Financing in Recovery is tighter than in other phases. Hard money loans, private equity, and bridge financing are your most realistic options when traditional lenders are still sitting on the sidelines. Understanding the mechanics of commercial real estate financing becomes especially valuable here.
- Hard Money Loans and Private Money Lending become prevalent, given tightened bank underwriting standards.
- Mezzanine Financing may be used to bridge equity gaps in repositioning strategies.
- Real Estate Syndication plays a critical role, pooling capital for larger distressed acquisitions.
Metrics to Watch
- Yield on Cost: A high yield relative to market cap rates indicates a strong upside.
- Equity Multiple: Projects acquired during Recovery often deliver equity multiples of 1.8x–2.5x over 5–7 years.
- Operating Expense Ratio: Improving efficiency in distressed assets boosts early cash flows.
- DSCR and LTV: Conservative leverage is crucial; DSCR above 1.3 and LTV under 70% is ideal in this fragile phase.
The 2010 U.S. recovery is a good reference point. Institutional investors who picked up distressed apartment portfolios in Phoenix and Atlanta at cap rates above 8% walked away with double-digit IRRs and equity multiples above 2.2x within six years. That’s the upside Recovery can deliver when you get in early with solid underwriting.
Recovery isn’t risk-free. But the entry discounts are the most attractive you’ll find anywhere in the cycle, and the potential for long-term capital appreciation is real, provided you go in with disciplined underwriting and a clear exit strategy.
2. Expansion
Expansion is the most energetic phase of the cycle. Property values are rising, vacancy rates are falling, and rental rate growth is accelerating. GDP growth is broad-based, jobs are being created, and consumer spending is up. That combination draws a surge of investor interest and development activity, and for good reason.
Key Indicators in Expansion
- Vacancy Rate: Falls below historical averages, often under 6% in healthy markets.
- Rental Rate Growth: Accelerates, often surpassing 4–5% annually in high-demand urban zones.
- Construction Starts: Surge across asset types, particularly in multi-family apartments, industrial properties, and commercial office buildings.
- Building Permits: Increase sharply, particularly in metros with pro-growth zoning.
- Consumer Confidence Index: Peaks, driving increased housing demand and speculative buying.
- Unemployment Rate: Drops significantly, often below 5%, increasing housing absorption.
- Cap Rate Compression: As competition intensifies, asset prices rise and NOI growth lags price increases, pushing cap rates lower.
Capital is widely available during this phase. You can access conventional mortgages, FHA and VA loans, and commercial mortgage-backed securities (CMBS) with relative ease. Lower interest rates combined with rising net operating income (NOI) give you the ability to refinance assets, improve yield on cost, and pull out equity to redeploy.
This is the sweet spot for buy-and-hold and stabilized core investing. Your focus shifts from hunting for acquisition discounts to building long-term rental income and riding appreciation. It’s a less exciting entry than Recovery, but it’s a highly productive one. For a look at how demographic trends shape real estate demand during expansion cycles, the dynamics are worth understanding.
In Expansion, your strongest plays are buy-and-hold in high-growth markets, core-plus investing in stabilized assets, and 1031 exchanges to upgrade your portfolio quality while deferring taxes.
- Cash Flow Investing: Strong rental growth supports healthy DSCRs, making leveraged acquisitions more viable.
- Development Projects: Developers launch new mixed-use developments, student housing, and senior living facilities to meet expanding demand.
- Refinancing: Investors restructure debt at favorable terms to lock in low rates and improve IRR.
Between 2014 and 2018, Class A apartment assets in Denver and Nashville delivered annual rental rate growth of 5 to 7%, with average IRRs exceeding 12% for core-plus investors. That’s the kind of steady, compounding performance Expansion tends to produce for those who stay positioned and patient.
Metrics to Monitor
- Break-Even Occupancy: Typically drops below 75% due to rising rents and operational efficiencies.
- Equity Multiple: Moderate return profiles with lower risk, often 1.5x–2x over 7–10 years.
- Operating Expense Ratio: Tends to remain flat or improve slightly due to economies of scale.
- Cap Rate Compression: A warning sign when too much capital inflates asset prices ahead of NOI growth.
Expansion offers consistent returns and low volatility, making it the most competitive but also the most accessible phase for a wide range of investors. That said, if you’re entering late in the cycle, you need to stay sharp about early signs of oversupply and build some conservatism into your underwriting assumptions.
3. Hyper Supply
Hyper Supply is when the market starts running too hot. Demand may still look strong on the surface, but the balance between new supply and actual absorption begins to crack. Prolonged cap rate compression and excessive construction starts fuel the imbalance, and what follows is a predictable sequence of declining returns, rising vacancies, and a looming correction.
Key Indicators in Hyper Supply
- Vacancy Rate: Begins to rise, typically exceeding 7–9%, especially in high-development metros.
- Rental Rate Growth: Slows down markedly or stalls altogether, despite new inventory entering the market.
- Property Absorption Rate: Drops significantly as the market becomes saturated.
- Building Permits and Construction Starts: Remain high due to projects initiated during Expansion, leading to delayed oversupply.
- Consumer Confidence Index: Remains high but may plateau as economic growth shows signs of fatigue.
- Interest Rates: Often begin to rise, reducing the attractiveness of leveraged investments.
This phase tends to sneak up on people. High absorption masks the oversupply problem early on, and by the time new inventory floods the market — especially Class A multi-family, retail centers, and commercial office buildings — rents are already stagnating and NOI is starting to slide. The Wall Street Journal’s real estate coverage often tracks these inflection points in real time.
Speculative construction without solid pre-leasing commitments makes things worse. When developers build on the assumption that tenants will show up, and they don’t, the oversupply compounds quickly.
Caution and selectivity are your most valuable tools here. Over-leveraged investors and developers face real distress risk. Your priorities shift to protecting net operating income and keeping capital expenditures tight.
In Hyper Supply, your focus should be on asset management over acquisition, selective dispositions of properties with limited upside, and defensive repositioning toward recession-resistant asset types like affordable housing and essential retail.
- Stabilized Core Investing: Focus on high-occupancy, low-volatility assets in supply-constrained submarkets.
- Asset Repositioning: Older assets may be upgraded cost-effectively to better compete with new inventory.
- Cash Flow Preservation: Emphasize maintaining existing leases and renewals at stabilized rents.
- Real Estate Syndication: Structures may shift toward income-focused returns rather than capital appreciation.
Between 2018 and 2019, cities like Seattle and Dallas saw vacancy rates in the multi-family sector climb from 5% to 8% within 12 months. Rent growth dropped below 2%, yields compressed, and the warning signs of saturation were clear to anyone watching the data closely.
Critical Metrics to Watch
- Break-Even Occupancy: Should be closely monitored—assets with thresholds above 80% become vulnerable.
- DSCR: May fall below 1.2x, increasing refinance risk.
- Yield on Cost: Margins shrink as NOI growth slows but expenses persist.
- LTV and IRR: Conservative underwriting should target LTV under 65% and IRR above 10% to absorb volatility.
Hyper Supply is a pivotal turning point in the cycle. Investors who stay grounded in fundamentals and prioritize stable income over momentum can navigate it well. Those chasing the tail end of a bull run tend to find out the hard way that the cycle doesn’t care about optimism.
4. Recession
Recession is the most difficult stretch of the real estate market cycle. Negative GDP growth, rising vacancy rates, and falling rental rate growth define the environment. It typically follows a period of Hyper Supply, when excess inventory collides with weakening demand, triggering value erosion and a sharp pullback in investor appetite.
Key Indicators in Recession
- Vacancy Rate: Often spikes above 10%, with certain commercial sectors reaching 15% or more.
- Rental Rate Growth: Turns negative; landlords may offer significant concessions or free rent periods.
- Unemployment Rate: Increases substantially, reducing household formation and business expansions.
- Property Absorption Rate: Falls dramatically, particularly in overbuilt markets and sectors.
- Construction Starts: Virtually halt as financing tightens and developers reassess risk.
- Consumer Confidence Index: Drops to cyclical lows, dampening both buying and leasing activity.
As operating income falls, property values follow. That decline hits net operating income (NOI) and triggers cap rate expansion, the opposite of compression, where values drop faster than income. At that point, investor priorities shift away from growth and toward capital preservation.
But here’s the thing. Recession also opens a rare window for opportunistic acquisitions, especially if you have liquidity and a long enough time horizon. The investors who build generational wealth often do it by buying in conditions that make everyone else nervous.
Your strongest strategies in Recession are distressed asset acquisitions, note buying at a discount, and long-term holds in recession-resistant sectors like affordable housing, mobile home parks, and self-storage. Diversifying across international property markets can also provide a buffer when a single market is deep in downturn.
- Distressed Property Acquisition: Lenders and over-leveraged owners often liquidate assets at discounts. REO (real estate owned) sales surge.
- Buy and Hold: Long-term investors can acquire assets at below-replacement cost and benefit from market recovery.
- Cash Flow Investing: Becomes more selective; emphasis is placed on preserving existing leases.
- Adaptive Reuse: Converts struggling asset types (e.g., outdated office buildings) into high-demand formats like multi-family or senior housing.
The 2020 COVID-19 downturn made this contrast crystal clear. Short-term rentals in urban markets saw occupancy collapse by 60 to 70% within weeks. Meanwhile, mobile home parks and affordable rentals held 90%+ occupancy with negligible rent reductions, dramatically outperforming on a risk-adjusted basis. Reuters’ real estate desk documented the divergence in real time.
Crucial Metrics to Monitor
- DSCR: Often falls below 1.0x in over-leveraged assets, increasing default risk.
- LTV: Refinancing becomes difficult if asset values drop more than 20%.
- Operating Expense Ratio: Spikes as revenues fall and fixed costs remain.
- Break-Even Occupancy: Projects with thresholds above 85% may struggle to cover debt service.
Recession is genuinely hard to operate in, but for well-capitalized investors with patience, it’s where the most attractive entry points emerge. The key is timing and discipline. Identifying markets that are approaching Recovery signals is far more profitable than trying to call the exact bottom. Bloomberg’s real estate analysis is one of the better sources for tracking those transition signals as they develop.
How To Invest Based On the Real Estate Cycle
Every property type has its own rhythm within the cycle, and the smartest investors tailor their approach accordingly rather than applying the same playbook across the board.
| Property Type | Recovery | Expansion | Hyper Supply | Recession |
|---|---|---|---|---|
| Multi-Family Apartments | ✅ Value-add | ✅ Buy & Hold | ⚠️ Lease Focus | ✅ Stabilized |
| Industrial Properties | ✅ Early Entry | ✅ Development | ✅ Retain Core | ✅ Leasebacks |
| Retail Centers | ⚠️ Risky | ✅ Repositioning | ❌ Avoid New Builds | ⚠️ Selective Core |
| Office Buildings | ⚠️ Convert | ✅ Class A Lease | ⚠️ Vacancy Risk | ❌ Risk-averse |
| Mobile Home Parks | ✅ Acquire | ✅ Hold | ✅ Income Stable | ✅ Top Performer |
| Airbnb/Short-Term | ❌ Risky | ✅ High Yield | ⚠️ Overbuilt Risk | ❌ Highly Volatile |
FAQ
What are the four phases of the real estate market cycle?
The four phases are Recovery, Expansion, Hyper Supply, and Recession. Each phase reflects different levels of supply, demand, property values, and investor opportunity.
How do vacancy rates signal a real estate downturn?
Rising vacancy rates often indicate oversupply and falling demand, signaling a shift from Expansion to Hyper Supply or Recession.
What should investors do during the Recovery phase?
Focus on acquiring undervalued or distressed properties, use value-add strategies, and prepare for long-term gains as the market rebounds.
Can real estate cycles differ by property type?
Yes. For example, multi-family may be in Expansion while retail or office is still in
Recession, depending on local demand and economic shifts.
During which phase of the real estate cycle is local government most directly involved?
Local governments are most involved during the Expansion phase—issuing building permits, updating zoning laws, and supporting infrastructure to meet growing development demand.
During which phase of the real estate cycle do residents engage with local amenities and services?
Residents engage most with amenities and services during the Expansion phase when job growth, population inflow, and disposable income are all rising.