
When you know how to read your financial statements, you can find ways to make more profit, expand your business, or catch problems before they grow.
What Is Financial Statement Analysis?
Financial statement analysis is a crucial process that allows investors, creditors, and other stakeholders to gain insights into the financial health and performance of a company. By examining various financial statements, analysts can assess the profitability, liquidity, solvency, and overall stability of an organization. This analysis helps in making informed decisions regarding investments, lending, and business partnerships.
The primary goal of financial statement analysis is to evaluate the financial position and performance of a company. It involves examining the relationships between different financial variables, such as revenues, expenses, assets, and liabilities, to understand the underlying trends and patterns. Through this analysis, stakeholders can identify potential risks, opportunities, and areas for improvement within the organization.

Importance of Analyzing Financial Statements
Analyzing financial statements is essential for several reasons. Firstly, it provides valuable information about a company’s financial health, which assists in assessing its creditworthiness. Lenders and creditors rely on financial statement analysis to determine the level of risk associated with providing loans or extending credit to a particular organization.
Furthermore, financial statement analysis helps investors evaluate the investment potential of a company. By examining key financial ratios and indicators, investors can gauge the profitability, growth prospects, and overall value of a business. This analysis enables them to make informed investment decisions and allocate their resources effectively.
Additionally, financial statement analysis assists management in monitoring the company’s performance and identifying areas of improvement. By regularly analyzing financial statements, management can track the progress toward achieving financial goals, identify operational inefficiencies, and take corrective actions to enhance profitability and operational efficiency.
Types of Financial Statements
Balance Sheet
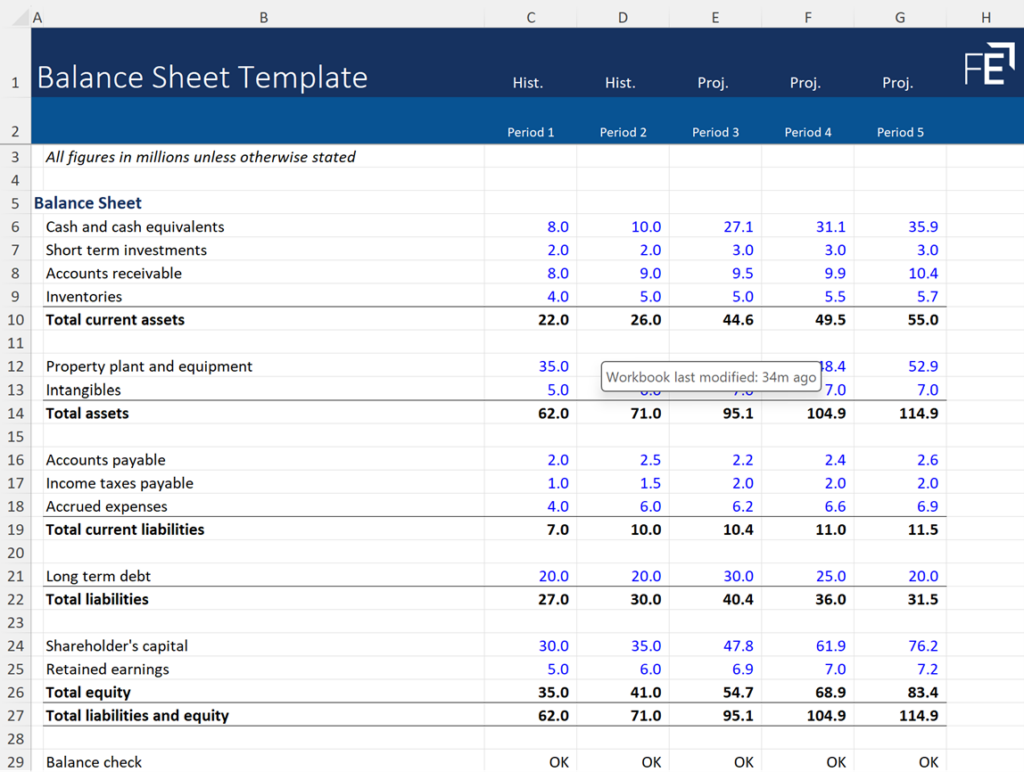
The balance sheet is one of the primary financial statements analyzed during the financial statement analysis process. It provides a snapshot of a company’s financial position at a specific point in time. The balance sheet consists of three main components: assets, liabilities, and shareholders’ equity.
Assets represent the resources owned by the company, such as cash, inventory, property, and equipment. Liabilities, on the other hand, represent the company’s obligations, including loans, accounts payable, and accrued expenses. Shareholders’ equity represents the residual interest in the company’s assets after deducting liabilities.
Analyzing the balance sheet helps in assessing the liquidity and solvency of a company. Key ratios, such as the current ratio and debt-to-equity ratio, can be calculated using balance sheet data to determine the company’s ability to meet its short-term obligations and its long-term financial stability.
Income Statement
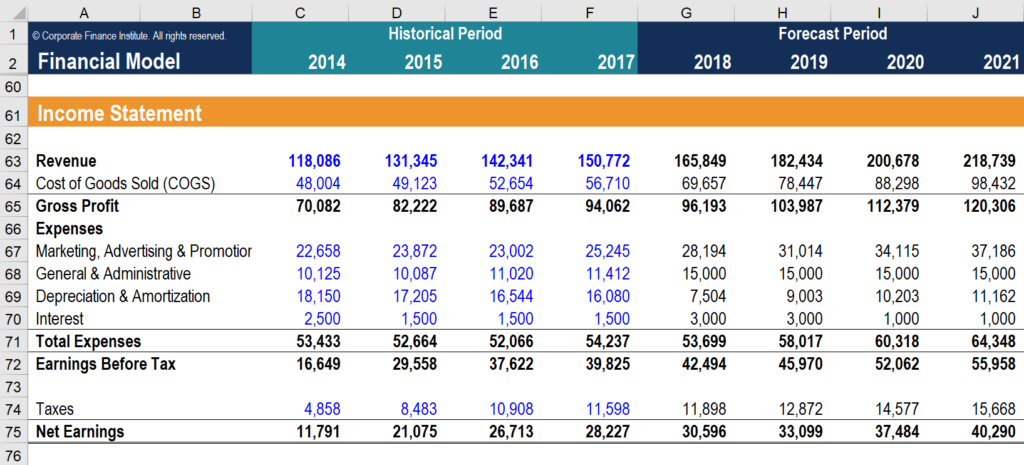
The income statement, also known as the profit and loss statement, provides information about a company’s revenues, expenses, and net income over a specific period. It highlights the company’s ability to generate profits from its core operations.
The income statement starts with the company’s revenues, which include sales, fees, and other income sources. It then deducts various expenses, such as cost of goods sold, operating expenses, and taxes, to arrive at the net income.
Analyzing the income statement helps in evaluating the company’s profitability and operating efficiency. Key ratios, such as gross profit margin and net profit margin, can be calculated using income statement data to assess the company’s ability to generate profits and control expenses.
Cash Flow Statement
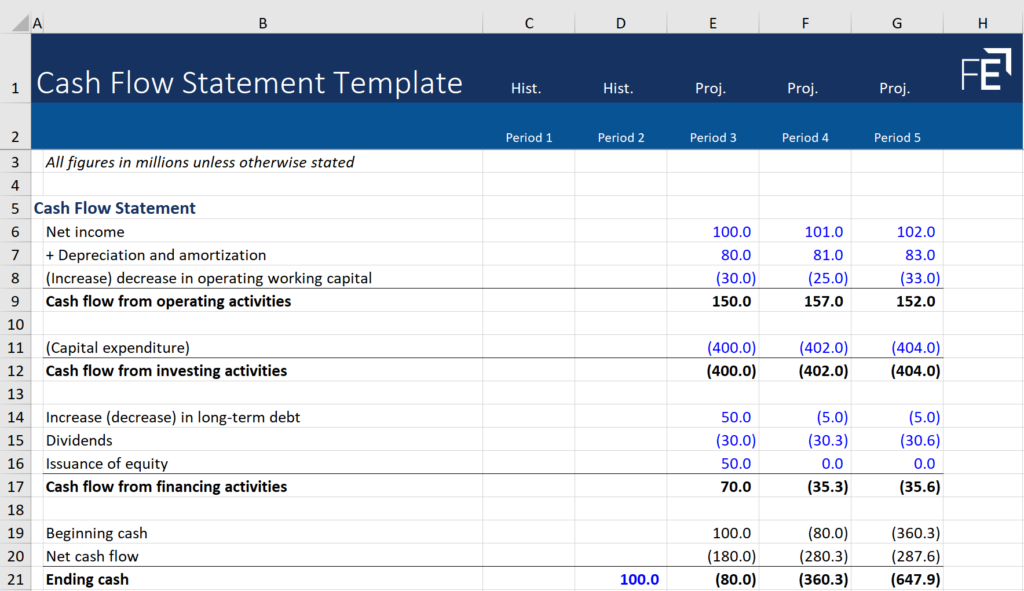
The cash flow statement provides insights into the inflows and outflows of cash within a company over a specific period. It consists of three main sections: operating activities, investing activities, and financing activities.
Operating activities encompass the company’s cash flows from its core operations, such as cash received from customers and cash paid to suppliers. Investing activities relate to the cash flows from buying or selling long-term assets, such as property, plant, and equipment. Financing activities involve the cash flows associated with raising capital, repaying debts, and distributing dividends.
Analyzing the cash flow statement is crucial for assessing a company’s liquidity and cash management. By examining the operating cash flow, investors and creditors can determine if the company generates sufficient cash to cover its operating expenses and obligations. It also helps in identifying the company’s investment and financing activities, which may impact its future growth and financial stability.
Free Cash Flow and Other Valuation Statements
In addition to the balance sheet, income statement, and cash flow statement, analysts often consider other valuation statements during the financial statement analysis process. These statements provide further insights into a company’s financial performance and value.
One such statement is the statement of retained earnings, which shows the changes in a company’s retained earnings over a specific period. It highlights the portion of the company’s profits that is retained for reinvestment or distribution to shareholders as dividends.
Another important statement is the statement of comprehensive income, which includes all changes in equity during a period that were not a result of transactions with shareholders. It provides a comprehensive view of the company’s financial performance, including items such as foreign currency translation adjustments and unrealized gains or losses on investments.
Lastly, analysts often calculate and analyze the free cash flow, which represents the cash generated by a company after deducting capital expenditures. Free cash flow is an important indicator of a company’s ability to invest in growth opportunities, repay debts, and distribute dividends to shareholders.
What are The Different Types of Financial Statement Analysis?
Horizontal Analysis
Horizontal analysis is a technique used to evaluate a company’s financial performance over a specific period. It involves comparing financial data from multiple periods to identify trends and changes. By conducting horizontal analysis, stakeholders can assess whether the company’s financial position is improving or deteriorating over time.
To perform horizontal analysis, one must compare financial data from consecutive years or quarters. This comparison allows for the identification of growth rates, shifts in revenue and expenses, and changes in key financial ratios. By understanding these trends, stakeholders can assess the company’s stability and its ability to generate consistent profits.
Vertical Analysis
Vertical analysis, also known as common-size analysis, is a method used to evaluate the relative proportions of different financial statement items. It involves representing each item as a percentage of a base amount, such as total assets or net sales. This analysis allows stakeholders to understand the composition of a company’s financial statements and identify any significant variations.
By conducting vertical analysis, stakeholders can identify changes in the structure of a company’s financial statements. They can determine the proportion of assets allocated to different categories, such as current assets or fixed assets. Similarly, they can assess the proportion of revenue allocated to different expense categories. Vertical analysis helps stakeholders understand the company’s financial structure and assess its efficiency and profitability.
Ratio Analysis
Ratio analysis is a powerful tool used to evaluate a company’s financial performance and health. It involves calculating and analyzing various financial ratios to assess the company’s liquidity, solvency, profitability, and efficiency. Ratio analysis provides stakeholders with a comprehensive view of the company’s financial condition and helps them make informed decisions.
There are several types of financial ratios, including liquidity ratios, profitability ratios, solvency ratios, and efficiency ratios. Liquidity ratios assess a company’s ability to meet short-term obligations, while profitability ratios measure its ability to generate profits. Solvency ratios evaluate a company’s long-term financial stability, and efficiency ratios assess its operational efficiency. By analyzing these ratios, stakeholders can gain insights into the company’s financial performance and compare it to industry benchmarks.

Steps To Analyze Financial Statements
Analyzing financial statements can be a complex process that requires a systematic approach.<br><br>
Gather And Review Financial Statements
The first step in analyzing financial statements is to gather the relevant documents, which typically include the balance sheet, income statement, and cash flow statement. These statements provide a snapshot of the company’s financial position at a specific point in time and its financial performance over a period. To ensure accuracy, it is essential to obtain the most recent financial statements available.
Once you have gathered the financial statements, the next step is to review them carefully. Start by examining the balance sheet, which presents the company’s assets, liabilities, and shareholders’ equity. Analyzing the balance sheet will help you understand the company’s liquidity, leverage, and overall financial strength. Look for any significant changes in the composition of assets and liabilities over time, as this can indicate potential risks or opportunities.
After reviewing the balance sheet, move on to the income statement. This statement provides information about the company’s revenues, expenses, and net income over a specific period. Analyzing the income statement will help you assess the company’s profitability, revenue growth, and cost management. Pay attention to trends in sales and expenses, as well as any unusual or non-recurring items that may affect the company’s financial performance.
Lastly, examine the cash flow statement, which reveals the company’s cash inflows and outflows during a given period. Understanding the cash flow statement is crucial for evaluating a company’s ability to generate cash and meet its financial obligations. Focus on the operating, investing, and financing activities sections to identify any significant changes in cash flow patterns. A positive operating cash flow indicates a healthy business, while negative cash flows may raise concerns about liquidity.
Calculate Financial Ratios
1. Quick ratio
The quick ratio (also called the acid test ratio) is like the current ratio—it measures how well your business can pay off its debts. However, it only looks at highly liquid assets, such as cash or assets that can easily be converted to cash—that is, money you can get your hands on quickly.
To calculate the quick ratio, use this formula:
Quick Ratio = (Cash and Cash Equivalents + Marketable Securities + Accounts Receivable) / Current Liabilities
Using the example above, the total number of cash and cash equivalents, plus accounts receivable, is $24,000. (Chelsea’s Ceramics doesn’t have any marketable securities.)
We don’t include the equipment line item in these assets, because selling off equipment isn’t a quick way to raise cash.
So, the formula looks like:
Quick Ratio = 24,000 / 11,000 = 2.18
Or a ratio of 2.18:1 (quick assets:liabilities).
So long as your quick ratio is 1:1 or higher, you’re doing well; you’ve got enough easy-to-liquidate assets to cover all your debts.
2. Debt-to-equity ratio
The debt to equity ratio tells you how much your business depends on equity versus borrowed money.
To calculate your debt-to-equity ratio, use this formula:
Debt to Equity Ratio = Total Debt / Owner or Shareholders’ Equity
Using the example above, we include the long-term debt, but not accounts payable, in the calculation.
So, our formula looks like this:
Debt to Equity Ratio = 10,000 / 25,000 = 0.4
Or a ratio of 0.4:1 (debt:equity).
In this case, Chelsea’s doing well. A 4:1 debt-to-equity ratio is considered acceptable. With all her retained earnings, Chelsea is able to run her business largely using her own money.
3. Current ratio
The current ratio measures your liquidity—how easily your current assets can be converted to cash in order to cover your short-term liabilities.
The higher the ratio, the more liquid your assets.
To calculate the current ratio, use this formula:
Current Ratio = Current Assets / Current Liabilities
If we use the example above, the calculation looks like this:
Current Ratio = 36,000 / 11,000 = 3.27
Meaning a ratio of 3.27:1 (assets:liabilities).
Your current ratio shouldn’t dip far below 2:1; if it’s less than 1:1, you don’t have enough current assets on hand to cover your short-term debts, and you’re in a tight position.
The higher your ratio, the better able you are to cover liabilities.
Compare Ratios And Industry Benchmarks
After calculating the financial ratios, the next step is to compare them to industry benchmarks and historical data. Industry benchmarks provide a point of reference to evaluate a company’s financial performance against its peers. By comparing ratios to industry averages, you can identify areas of strength or weakness and gain insights into the company’s competitive position.
When comparing ratios to industry benchmarks, it’s important to consider the company’s size, industry, and unique circumstances. A small company may have different financial ratios compared to a large corporation, and each industry may have its own set of benchmarks. Therefore, it’s essential to use industry-specific benchmarks and adjust for any unique factors that may affect the company’s performance.
Additionally, comparing ratios to historical data allows you to identify trends and patterns in the company’s financial performance. Look for any significant changes or deviations from previous periods, as this can provide valuable insights into the company’s financial trajectory. Positive trends may indicate growth opportunities, while negative trends may suggest underlying issues that need to be addressed.
Identify Trends Over Time
Analyzing financial statements goes beyond just comparing ratios to industry benchmarks; it also involves identifying trends over time. By analyzing financial trends, you can gain a deeper understanding of the company’s financial performance and identify potential risks or opportunities.
Start by examining key financial metrics, such as revenue growth, net income growth, and cash flow growth. Look for consistent patterns of growth or decline over multiple periods. A company with consistent revenue and profit growth may indicate a well-managed and stable business, while inconsistent or declining growth rates may raise concerns.
Furthermore, analyze trends in the company’s financial ratios. Look for any patterns of improvement or deterioration in liquidity, profitability, efficiency, and solvency ratios. These trends can provide insights into the company’s financial management practices and its ability to adapt to changing market conditions.
Interpret Findings And Draw Conclusions
The final step in analyzing financial statements is to interpret the findings and draw conclusions. By synthesizing the information gathered from reviewing the financial statements, calculating ratios, and comparing benchmarks, you can develop a comprehensive understanding of the company’s financial health and performance.
Based on your analysis, identify the company’s strengths and weaknesses. Consider the potential risks and opportunities that arise from the analysis of the financial statements. Are there any red flags or areas of concern that need further investigation? Conversely, are there any positive indicators that suggest a promising future?
Finally, use your analysis to make informed decisions and recommendations. Whether you are an investor, lender, or manager, the insights gained from analyzing financial statements can guide your decision-making process. Consider the company’s financial position, profitability, liquidity, and long-term sustainability when formulating your conclusions and recommendations.


