Housing bubbles represent a recurring feature of property markets worldwide, reflecting what UBS describes as “substantial and sustained mispricing, which is only evident in retrospect,” yet certain patterns of excess become identifiable before collapse occurs if investors know what signals to watch.
The challenge lies in distinguishing between genuine appreciation driven by fundamental demand versus speculative momentum that inevitably reverses once sentiment shifts or financing conditions tighten.
What defines housing bubble risk extends beyond simple price increases to examine the relationship between asset values and underlying economic fundamentals. The critical indicators include growing disconnects between prices and local incomes or rents, imbalances created by excessive lending or construction activity, and price to income ratios stretching beyond levels that local economies can sustainably support through wage growth and productivity improvements.
When these metrics diverge sharply from historical norms while investor enthusiasm remains high, the conditions for eventual correction intensify even if timing remains uncertain.
Table of Contents
Top 10 Housing Markets at Bubble Risk (UBS Global Real Estate Bubble Index 2025)
| Rank | City | Bubble Risk Category | UBS Bubble Risk Score |
|---|---|---|---|
| 1 | Miami | High | 1.73 |
| 2 | Tokyo | High | 1.59 |
| 3 | Zurich | High | 1.55 |
| 4 | Los Angeles | Elevated | 1.11 |
| 5 | Dubai | Elevated | 1.09 |
| 6 | Amsterdam | Elevated | 1.06 |
| 7 | Geneva | Elevated | 1.05 |
| 8 | Toronto | Moderate | 0.80 |
| 9 | Sydney | Moderate | 0.80 |
| 10 | Madrid | Moderate | 0.77 |
Which Cities Have The Highest Housing Bubble Risk?
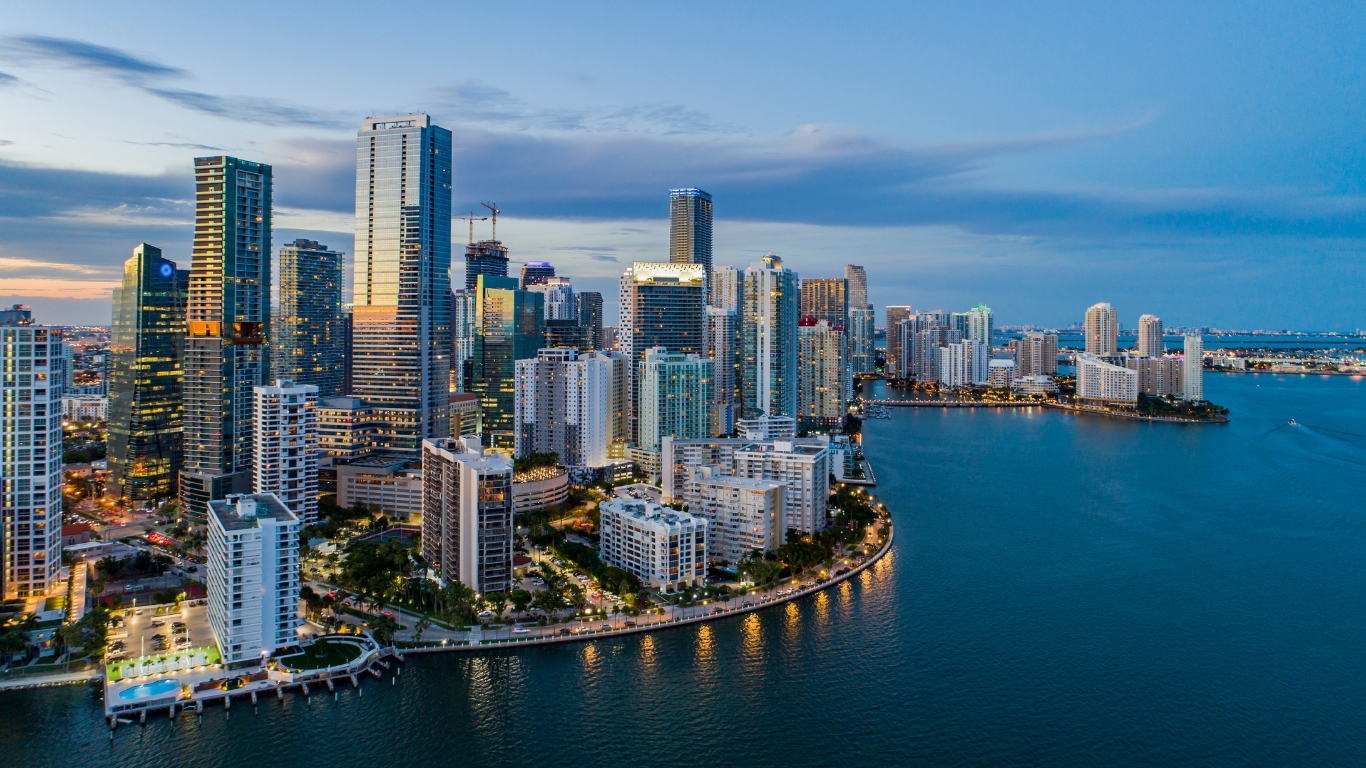
In 2025, UBS ranks Miami, Tokyo, and Zurich as the cities with the highest housing bubble risk, with scores of 1.73, 1.59, and 1.55 respectively. In each market, real house prices have risen much faster than local rents and incomes, signalling a clear disconnect from fundamentals rather than a normal, income-driven price cycle.
UBS’s 2025 Global Real Estate Bubble Index identifies three cities in the highest risk category, each with index scores exceeding 1.5 on the standardized bubble risk scale. Miami tops the rankings with a score of 1.73, followed by Tokyo at 1.59 and Zurich at 1.55. All three sit firmly in the “high risk” band where historical patterns suggest elevated probability of eventual correction.
Miami’s extreme positioning reflects the strongest long term price appreciation among all cities studied. Over the past 15 years, Miami has posted inflation adjusted housing appreciation exceeding 5% per annum on average according to WealthBriefing analysis of UBS data, a pace that dramatically outstrips local income growth and creates widening affordability gaps. More concerningly, current price to rent ratios now exceed the extremes reached during the 2006 U.S. housing bubble that preceded the subprime mortgage crisis and global financial collapse.
What makes Miami’s bubble characteristics particularly interesting is that traditional price to income metrics actually appear relatively reasonable compared to other global cities.
UBS notes it takes approximately five years of income to purchase a 60 square meter apartment in Miami, versus ten plus years in Paris, London, and Tokyo, and 14 years in Hong Kong.
This suggests Miami’s bubble risk stems more from price to rent dynamics and capital flow patterns, where investor demand pushes purchase prices far above what rental income justifies, rather than classic local income misalignment that defines bubbles in markets like San Francisco or Sydney.
Tokyo’s 1.59 bubble score reflects persistent price increases occurring despite only modest rent and income gains creating fundamental disconnect. Inflation adjusted home prices in Tokyo have surged approximately 35% higher than five years ago, while real rents and incomes have risen only in low to mid single digits.
Tokyo’s affordability stress becomes evident in price to income ratios exceeding ten years of income required to purchase a 60 square meter apartment according to WealthBriefing, grouping it with Paris and London as markets where prices have clearly decoupled from local wage levels.
On a shorter one year view, Tokyo recorded over 5% real price growth, putting it among the strongest performers globally during 2024 and 2025 despite Japan’s broader economic stagnation and demographic headwinds from aging population and shrinking household formation.
At the same time, Zurich presents perhaps the most extreme fundamental disconnect in the entire global study. The city’s 1.55 bubble index score understates the severity of valuation extremes when examining specific metrics.
UBS highlights Zurich as exhibiting the clearest fundamental mismatch: home purchase prices are 60% higher than a decade ago, property values have risen approximately twice as fast as rents, and property values have increased roughly five times as fast as local incomes.
Most strikingly, Zurich maintains the world’s highest price to rent ratio in the entire UBS universe, with 43 years of rent needed to buy an apartment of the same size according to LinkedIn coverage, versus 15 years in Dubai and 27 years in Paris. This extreme multiple indicates that purchasing property in Zurich makes virtually no economic sense based on rental yield, with buyers relying entirely on continued price appreciation to justify investments that generate minimal income relative to capital deployed.

Los Angeles, Dubai, and Amsterdam Enter Elevated Risk Territory
Beyond the three cities in outright bubble territory, UBS identifies four additional markets in the “elevated risk” band with scores between 1.0 and 1.5, not as extreme as Miami, Tokyo, and Zurich, but clearly stretched beyond sustainable fundamentals.
Los Angeles, Dubai, Amsterdam, and Geneva each exhibit specific vulnerabilities that place them one tier below bubble classification but still facing meaningful correction risk if conditions shift.
Los Angeles presents an unusual bubble profile with an elevated risk score of 1.11, making it the second riskiest U.S. city after Miami according to Business Insider. What distinguishes LA’s risk is that the bubble dynamic is driven “not by strongly rising house prices, but by comparatively low rent levels“.
Price to rent ratios have become extremely elevated even though real prices have barely risen since mid 2023, indicating that rental markets have weakened substantially while purchase prices remain stubbornly high.
At the same time, Dubai sits at elevated bubble risk with a UBS score around 1.09 according to United Kingdom sources, driven by extraordinary short term price acceleration. Since mid 2023, real housing prices in Dubai have risen by double digits, with UBS pointing to approximately 11% real growth over the last year.
Over a five year cumulative period, real prices are now approximately 50% higher, making Dubai and Miami jointly the strongest performing markets globally during this timeframe.
Dubai’s population has grown nearly 15% since 2020, providing some fundamental support for price increases, yet building permit data points toward new construction returning to 2017 peak levels. This creates oversupply risk where massive development pipelines could flood the market with inventory just as price momentum attracts maximum investor attention, the classic late cycle dynamic where supply response arrives precisely when speculative demand peaks, triggering corrections as absorption slows.
Despite the surge, Dubai maintains relatively reasonable valuations on traditional metrics compared to other bubble risk cities. Price to income ratios approximate five years versus ten plus years in London, Paris, and Tokyo, while price to rent multiples sit around 15 years versus 43 years in Zurich.
This suggests Dubai’s elevated risk stems more from momentum and supply concerns rather than extreme fundamental misalignment, potentially allowing for softer landing if construction moderates or demand proves sustainable.
Lastly, Amsterdam enters elevated risk territory with a score around 1.06, reflecting modest recent price growth combined with policy headwinds that could trigger faster corrections. Real prices in Amsterdam rose approximately 4% since 2023 but only roughly 5% over the past decade, indicating that current valuations are high relative to modest long term appreciation rather than reflecting explosive recent gains.
Geneva rounds out the elevated risk cohort with a score slightly above 1.0 at approximately 1.05. Real house prices in Geneva rose about 4% over the last year and roughly 1% to 2% annually over the past decade, lifted again after the Swiss National Bank’s move back to 0% interest rates.
Geneva combines high purchase prices with relatively low rental yields according to WealthBriefing, making it vulnerable to changes in interest rates and economic conditions, the classic symptom of an income poor market where prices rely on continued cheap financing and capital appreciation expectations rather than fundamental rental economics.

Why Housing Bubble Risks Matter for Your Portfolio
Housing bubbles matter for investors because when overvalued markets correct, prices can fall 20–30%, eroding homeowner equity and spilling over into banks, credit conditions, and the broader economy as seen after 2008. Concentrated exposure to high-risk cities can therefore magnify portfolio drawdowns and liquidity stress precisely when macro conditions are already under pressure.
The cascading wealth destruction that follows housing bubble bursts extends far beyond immediate price declines to create multi year financial damage for homeowners, investors, and entire economies.
When housing bubbles collapse, average price declines typically range from 20% to 30% according to historical patterns from previous cycles, wiping out years of equity accumulation in months. Homeowners who purchased at or near peak valuations face negative equity situations where mortgage debt exceeds property values, forcing difficult choices between continuing payments on underwater assets or walking away through foreclosure or short sales.
The 2008 global financial crisis demonstrated how housing market corrections propagate through entire economic systems rather than remaining contained to real estate sectors. U.S. home prices fell approximately 30% peak to trough in many markets, triggering waves of mortgage defaults that destroyed trillions in household wealth, bankrupted major financial institutions holding mortgage backed securities, and contributed to the deepest recession since the Great Depression with unemployment exceeding 10% and GDP contracting sharply..
For investors evaluating whether current bubble warnings justify portfolio changes or defensive positioning, the UBS analysis provides data driven evidence that specific major markets have reached valuation extremes and fundamental disconnects historically associated with eventual correction.
While timing remains uncertain and soft landings remain possible if economic growth accelerates, income gains catch up to prices, or monetary policy remains supportive indefinitely, the probability of painful adjustments has clearly risen when Miami, Tokyo, and Zurich all simultaneously register bubble level scores for the first time while multiple other major markets sit just below that threshold in elevated risk territory.
FAQ
Which cities have the highest housing bubble risk in 2025?
Miami leads global housing bubble risk with a UBS index score of 1.73, followed by Tokyo at 1.59 and Zurich at 1.55. All three exceed the 1.5 threshold for high risk classification. Miami shows the strongest 15 year price appreciation at over 5% annually in real terms, while Zurich maintains the world’s highest price to rent ratio at 43 years.
Are we in a housing bubble right now?
Not globally. Although housing prices are historically high in many countries and affordability is under pressure, most analysts do not classify today’s conditions as a classic housing bubble. The defining feature of past bubbles—systemic, reckless mortgage lending—is largely absent across developed markets. That said, localized bubble risk exists in certain global cities and regions, including Miami and Los Angeles (U.S.) and Tokyo (Japan), where prices have outpaced local income and rent growth.
Will home prices go down in 2025?
Globally, broad price declines are not the base-case scenario for 2025. Most forecasts point to low single-digit price growth or flat performance, reflecting a transition toward a more balanced market. Some countries or cities may experience modest corrections, while others continue to see mild appreciation, depending on interest rates, supply constraints, and local demand dynamics.