
Variance quantifies the spread of a stock’s returns from its average, marking volatility and risk levels. On the other hand, covariance assesses how two assets’ returns move together, offering insight on their relationship.
For investors, comprehending these concepts is essential.
It aids in achieving portfolio diversification, balancing between risks and rewards. Such understanding fosters better decision-making and enhances risk management within financial ventures.
Understanding Variance in Stocks
Variance is key in finance, especially for stock evaluations. It’s how we measure the spread of data around its average. This concept is crucial for investors. It aids them in grasping the volatility of assets and crafting sound investment strategies.
Variance indicates how far numbers are spread from their mean. For stocks, high variance shows big price swings, meaning more risk. On the flip side, a stable stock price, or low variance, suggests less risk.
Variance Formula Explained
To calculate variance, you find the mean of the squares of differences from the expected value. The formula looks like this:
σ² = Σ [(x - μ)² * P(x)]
Where:
σ²is the variance,xrepresents each number in the set,μis their mean, andP(x)estimates the probability ofx.
This calculation is crucial for understanding volatility and risk in investments.
Key Applications of Variance in Financial Analysis
Variance is vital in finance for several reasons:
- Risk Assessment: It allows investors to measure stock risks, leading to better portfolio selection.
- Portfolio Diversification: Knowing variance aids in picking a mix of assets, reducing risk by combining varying volatility levels.
- Quantitative Trading: It’s used in algorithmic trading to predict price fluctuations and enhance profits.
Utilizing variance in analysis provides deeper market insights. This helps investors make well-informed choices.
Moreover, understanding variance, along with covariance, is crucial for creating diverse, balanced investment strategies. These measures help investors understand asset relationships, key to managing risk and return effectively.
What is Covariance in Stocks
Covariance is crucial for understanding stock price movements and their correlations, vital for risk management. By studying how different stocks move together, investors and financial analysts gather insights. These insights help in creating a well-diversified portfolio, making it more resistant to market changes.
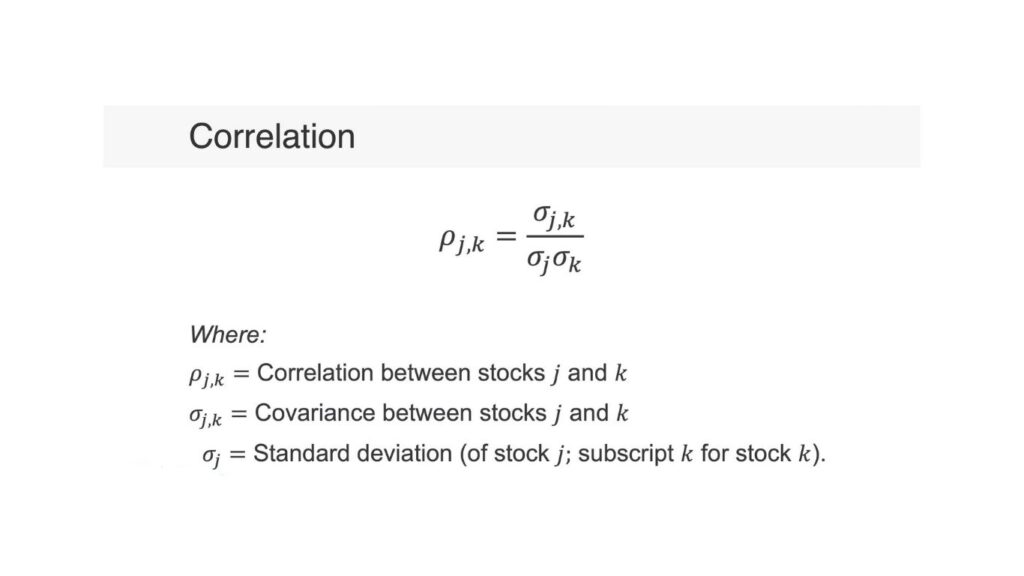
Covariance measures how two stocks move in relation to each other. It’s determined by analyzing the returns of two assets over time to see if they’re positively or negatively correlated.
A positive covariance indicates stocks move in the same direction. Conversely, a negative one suggests an inverse relationship. Grasping this concept is key in building a risk-reducing portfolio diversification strategy.
Positive covariance means if one stock’s price goes up, the other is likely to follow. On the other hand, negative covariance signifies that when one stock’s price climbs, the other’s falls.
This principle is central in risk management and correlation analysis. Using these insights, portfolio managers assemble portfolios that weather market volatility by mixing assets with varying covariances.
How to calculate Covariance
To calculate covariance, these steps are essential:
- First, find the average return for each stock within the period.
- Evaluate how far each return deviates from its average, for both stocks.
- Then, multiply these deviations together for corresponding times.
- Add these products together.
- Lastly, divide this sum by the total observations minus one.
This covariance calculation involves understanding both variable interactions and their standard deviations. Such calculations are indispensable for assembling a diversification strategy that judiciously balances risk against return.
Through detailed covariance analysis, investors uncover asset relationships, enabling a strategic approach to portfolio diversification. This approach is a cornerstone of correlation analysis, offering deeper insights into market dynamics and investment potential.
Differences between Variance and Covariance in Stocks
In finance, variance and covariance are foundational concepts. They are crucial for asset allocation, portfolio diversification, and understanding the dynamics of financial markets.
Grasping these concepts is key to making informed investment decisions and optimizing portfolio performance.
Purpose
Variance and covariance serve distinct purposes in finance. Variance measures the spread of returns for a single stock around its mean. It highlights how much the stock’s returns deviate from the average, providing insight into the stock’s volatility and risk profile.
A high variance indicates a more volatile stock, while a low variance suggests more stability.
On the other hand, covariance assesses how the returns of two stocks move in relation to each other. It can be positive, negative, or zero:
- Positive covariance indicates that the two stocks tend to move in the same direction.
- Negative covariance suggests that the stocks move in opposite directions.
- Zero covariance means there is no discernible relationship between the movements of the two stocks.
While variance focuses on individual asset risk, covariance uncovers how different assets interact within a portfolio.
This distinction is crucial in portfolio theory, which seeks to minimize risk through diversification.
Understanding these differences allows investors to better manage risk and enhance returns by strategically selecting assets that complement each other.
Impact on Portfolio Diversification
An understanding of variance and covariance is essential for effective portfolio diversification. Variance provides insights into the risk level of individual assets, helping investors select stocks with varying degrees of risk. This is important for balancing the overall portfolio risk.
Covariance, however, plays a more strategic role in diversification. By analyzing the covariance between different assets, investors can determine how those assets move in relation to one another.
- If the assets have high positive covariance, they are likely to increase and decrease together, which could amplify risk.
- Negative covariance is more desirable for diversification because it indicates that the assets move in opposite directions, which can reduce overall portfolio volatility.
For example, if a portfolio contains tech stocks like Apple (AAPL) and Google (GOOGL), which often move together (high positive covariance), the risk of the portfolio could be high.
To mitigate this, an investor might add a stock from a different sector, like utilities, which may have a negative covariance with tech stocks, thus stabilizing the portfolio during market downturns.