
The right tools can completely change how you trade. Get a deeper look at the stock market tools that serious traders are using right now to stay ahead of the curve.
Quick note before we dive in. The tools covered here reflect our own assessment of what works well for traders at various levels. The Luxury Playbook is an independent platform, and the opinions you’ll find here are entirely our own. We have no direct affiliation, sponsorship, or partnership with any of the tools mentioned. Our picks are based purely on features, functionality, and real potential value for traders like you.
When it comes to stock trading, having the right tools in your corner can be the difference between a profitable year and a painful one. Stock market tools give you real-time data, sharp analysis, and the kind of market intelligence that helps you make confident, informed decisions. Whether you’re just getting started or you’ve been trading for years, knowing which tools to use and how to use them is one of the smartest edges you can build.
Importance of Using Stock Market Tools
Stock market tools are not a nice-to-have. For any trader who takes performance seriously, they’re essential. They feed you real-time data and sharp analysis so your decisions are grounded in facts, not gut feeling. One of the biggest advantages is the ability to spot trends and patterns before they become obvious to everyone else. By studying historical data alongside current market conditions, you can identify opportunities early and position yourself for profitable trades.
Risk management is the other side of this equation, and it’s just as critical. Good tools help you assess the risk on every trade before you place it. You can set stop-loss orders, calculate risk-reward ratios, and build mitigation strategies that protect your capital when the market moves against you. That kind of discipline is what separates traders who last from those who don’t. If you want to understand how broader market forces can wipe out even well-structured positions, this breakdown of black swan events in the stock market is worth your time.

AI Tools for Stock Trading
Artificial intelligence has completely reshaped how traders approach the market. AI tools tap into advanced algorithms and machine learning to process enormous volumes of data in seconds, flagging trading opportunities that would take a human analyst hours to find. They can scan historical price patterns, read news sentiment, and track market trends to generate predictions and recommendations with a level of speed and accuracy that’s hard to match manually. Some of the best AI tools go even further, automating trade execution based on strategies you define in advance.
Best Paid AI Tool for Stock Trading
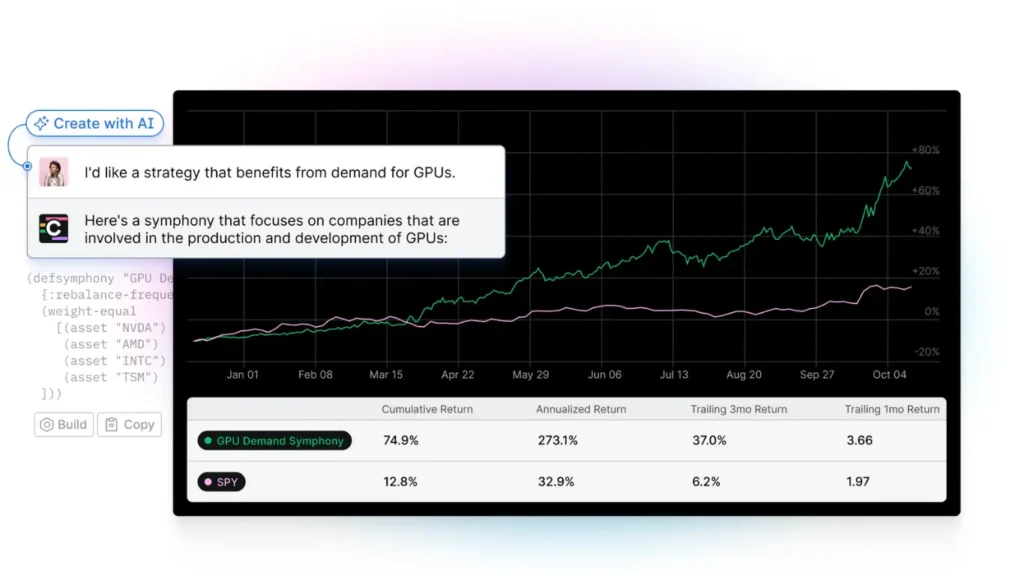
Composer.trade
Composer is an all-in-one platform built for traders who want the power of AI-driven algorithms without needing to write a single line of code. You can build custom trading strategies, backtest them against historical data, and let the platform execute trades automatically on your behalf. It comes loaded with ready-to-use strategies, charges zero commissions, and gives you a clean interface with if-else conditional logic and precise filtering so you stay in full control of every decision. The community is another real asset, with active traders sharing perspectives and strategies every day.
Key Capabilities
- Build trading algorithms with AI, backtest, and execute in one platform, no coding skills required.
- AI-powered strategy creation based on natural language input through an AI-assisted editor.
- Composer executes trades automatically, including rebalancing.
- Invest in ready-to-use strategies across purpose-driven categories, and data-driven decisions.
- Zero commissions, zero management fees, full automation, and account funding in-app.
Best Free AI Tool for Stock Trading
Finchat.io
FinChat is one of the sharpest free options out there for traders who want verified data without the noise. Beyond just delivering numbers, it helps you actually visualize what the data is telling you. Stacked bar charts, stacked area graphs, grouped bar views, they’re all there to help you make sense of complex financial information at a glance. When the numbers are this clear, better decisions tend to follow.
Key Capabilities
- Access to vast global stock coverage.
- Verified and precise data on public companies.
- Detailed insights and comprehensive performance summaries.
- Visual representation of financial data.
Best Stock Charting Tools
Stock charting tools are the backbone of technical analysis. They turn raw price data into visual maps you can actually read and act on, giving you chart types, indicators, and drawing tools to help you decode market behavior. Platforms like TradingView, StockCharts, and eSignal are among the most widely used. With the right charting setup, you can spot trends, pin down support and resistance levels, and find cleaner entry and exit points than most traders around you.
TradingView
TradingView stands out as the most user-friendly market analysis and charting platform available right now. It works for everyone from first-time traders just learning the ropes to seasoned pros running complex multi-asset strategies. The technical and fundamental analysis tools are deep without being overwhelming, and the built-in news feed keeps you connected to real-time developments on the securities you’re watching. The community is another major draw, connecting traders and investors from across the globe to share ideas, debate setups, and learn from each other.

Stock Trading Analysis Tools
Stock trading analysis tools help you dig into the fundamentals behind any position you’re considering. You get access to financial statements, earnings reports, and the kind of company-level data that tells you whether a business is actually healthy or just well-marketed. By working through this information, you can size up a company’s financial position, assess its growth trajectory, and understand where it sits competitively. Bloomberg Terminal, Morningstar, and Yahoo Finance are among the most trusted names in this space, and each one plays a role in helping you build a complete, research-backed view before committing capital.
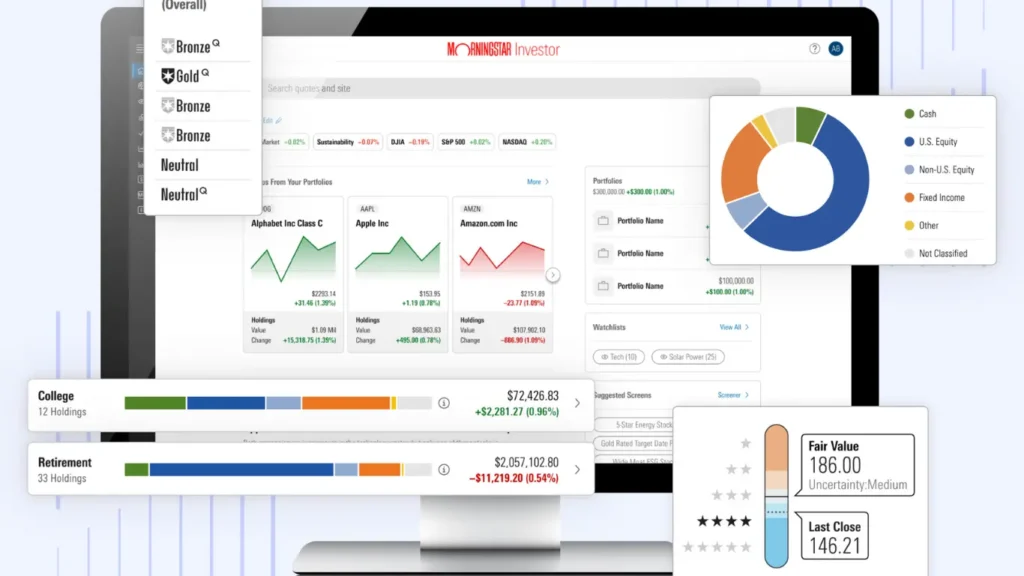
MorningStar Inc.
Morningstar is a Chicago-based investment research firm that compiles and analyzes fund, stock, and broader market data. Their product lineup spans internet tools, software platforms, and print publications, all designed to serve individual investors, financial advisors, and large institutional clients alike.
Their research spans the globe, covering North America, Europe, Australia, and Asia. Among their most relied-upon products are the comprehensive one-page mutual fund and ETF reports that investors use to assess the quality of more than 2,000 funds. Publications like The Motley Fool regularly lean on Morningstar as a primary data source, which tells you something about the depth of trust the firm has earned. If you’re also thinking about diversifying beyond equities, it’s worth exploring how to analyze and invest in bank stocks as part of a broader strategy.
Economic Calendar Tools
Economic calendar tools keep you ahead of the events that move markets. They lay out the schedule of key economic releases and decisions, things like GDP growth figures, central bank interest rate calls, and employment reports, so you always know what’s coming and when.
By staying on top of these events, you can anticipate volatility before it hits and adjust your positioning accordingly. Platforms like DailyFX and Forex Factory are popular choices for traders who lean into news trading and fundamental analysis. Knowing the calendar gives you a real edge when the rest of the market is caught off guard.
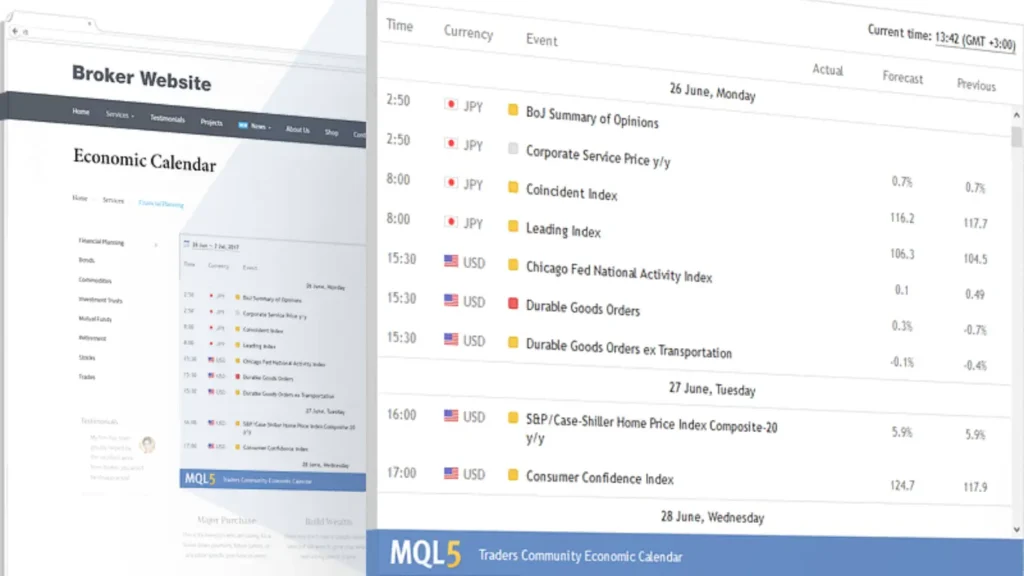
DailyFX Economic Calendar
An economic calendar maps out the scheduled dates of major releases and events that can shift individual securities or entire markets. Traders and investors use it to plan trades in advance, time portfolio adjustments, and watch for the technical chart patterns and indicator signals that often appear around these events. Most major financial and market websites offer economic calendars for countries around the world, and many of them are completely free to access.
Best Risk Management Tools
Risk management is not optional in serious trading. The best risk management tools help you size your exposure correctly, protect your downside, and stay disciplined when markets get messy. Features like stop-loss orders, trailing stops, and position-sizing calculators are the backbone of any sound risk framework. Platforms like TradeStation, Thinkorswim, and Interactive Brokers all deliver strong risk management functionality that can help you trade with confidence rather than anxiety. And if you’re thinking about how portfolio structure ties into risk, the couch potato portfolio strategy offers a surprisingly elegant approach worth knowing about.
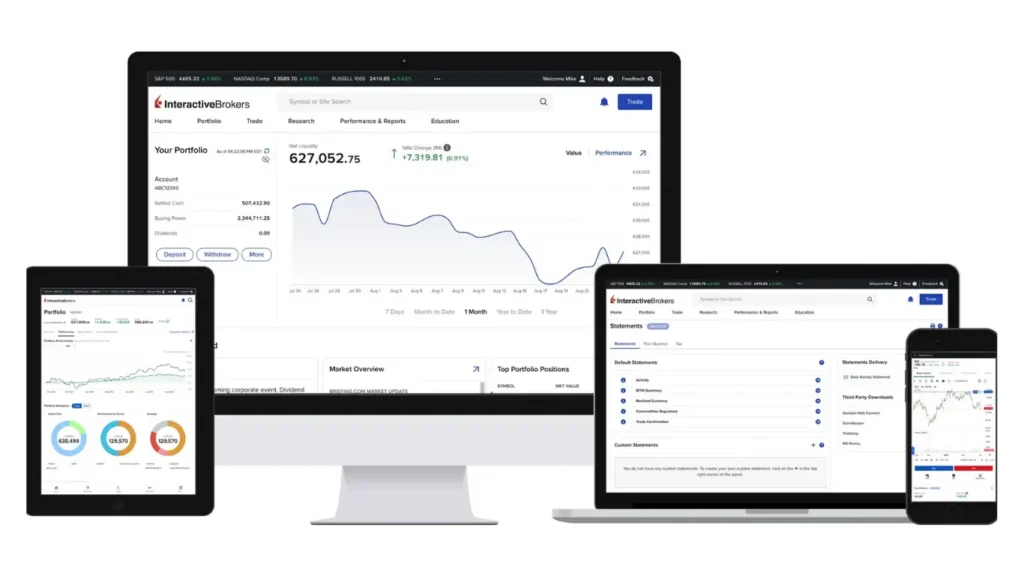
Interactive Brokers
Interactive Brokers is an American multinational brokerage firm and the operator of the largest electronic trading platform in the United States by daily average revenue trades. Through the platform, you can trade stocks, options, futures, EFPs, futures options, forex, bonds, funds, and select cryptocurrencies, all from a single account.
Best Institutional Holding Trackers
Institutional holding trackers give you a window into what the biggest players in the market are actually doing. Mutual funds, pension funds, hedge funds, these institutions move serious capital, and knowing which stocks they’re buying or selling can tell you a great deal about where smart money is flowing.
By keeping tabs on institutional positioning, you can spot emerging trends before they become obvious and make smarter, better-timed trading calls. Tools like WhaleWisdom, Insider Monkey, and GuruFocus are among the best for this kind of tracking. They’re especially useful if your strategy leans on trend-following or momentum-based approaches, where following institutional conviction can give your own trades a meaningful tailwind. You might also find it worth exploring whether small caps deserve a place in your portfolio, since institutional movement in that space can be a powerful signal.
Best Technical Indicators and Oscillators
Technical indicators and oscillators are among the most widely used tools in a trader’s toolkit, and for good reason. They help you read price action with more precision, flagging overbought or oversold conditions, potential trend reversals, and cleaner entry or exit setups. Moving Averages, the Relative Strength Index (RSI), and Bollinger Bands are some of the most relied-upon tools in this category. If your trading approach is built on technical analysis, getting fluent with these indicators is not negotiable.
FAQ
What Tools Do Traders Need?
The specific tools required may vary depending on individual trading strategies and preferences. However, some essential tools that every trader should have include a reliable trading platform, stock charting software, economic calendar, risk management tools, and access to research and analysis tools. It is also important to stay updated with the latest market news and developments through news websites or platforms.
What Indicator Do Most Traders Use?
Moving Averages, RSI, and Bollinger Bands are three popular indicators used by many traders. Moving Averages are used to identify trends and potential support or resistance levels. RSI is used to identify overbought or oversold conditions, indicating potential trend reversals. Bollinger Bands help traders identify volatility and potential price breakouts. These indicators are versatile and can be used in various trading strategies.


