
In today’s markets, knowing where money is moving is one of the smartest ways to spot new opportunities. That’s why many investors keep a close eye on ETF flows—the money going into or out of exchange-traded funds. These flows can show where big institutional players, often called “smart money,” are putting their capital.
When tracked carefully, ETF flows reveal what parts of the market investors are favoring, what trends they expect to grow, and even where they might be pulling back.
For example, in 2024, ETFs worldwide pulled in over $1.1 trillion in new money, which was the highest ever recorded. A large chunk of this went into funds focusing on themes like artificial intelligence and clean energy, showing how investors are betting on long-term growth stories.
At the same time, some defensive sectors, like consumer staples and utilities, saw money leaving, hinting that many investors were getting more comfortable taking on risk.
ETF flows aren’t just numbers. They’re signals of what professional investors—hedge funds, pension funds, and global asset managers—are doing with their money. Because these players often make moves ahead of broader market shifts, watching ETF flows can help regular investors see possible turns in the market before they fully play out.
It’s also important to realize how big ETFs have become.
As of early 2025, ETFs hold more than $12.8 trillion globally, more than double what they held just five years ago. That means when money rushes into or out of ETFs, it can move the prices of the stocks, bonds, or commodities those funds hold. This is why following ETF flows isn’t just interesting—it can actually give investors an edge.
In this article, we’ll break down exactly what ETF flows are, the different types of flows to look for, how they reflect investor thinking, and how to analyze them. We’ll also weigh the pros and cons of tracking ETF flows and look ahead to trends and forecasts through 2026.
By the end, you’ll see why ETF flows are such a powerful way to understand where the market’s smart money is headed.
Table of Contents
What are ETF Flows?
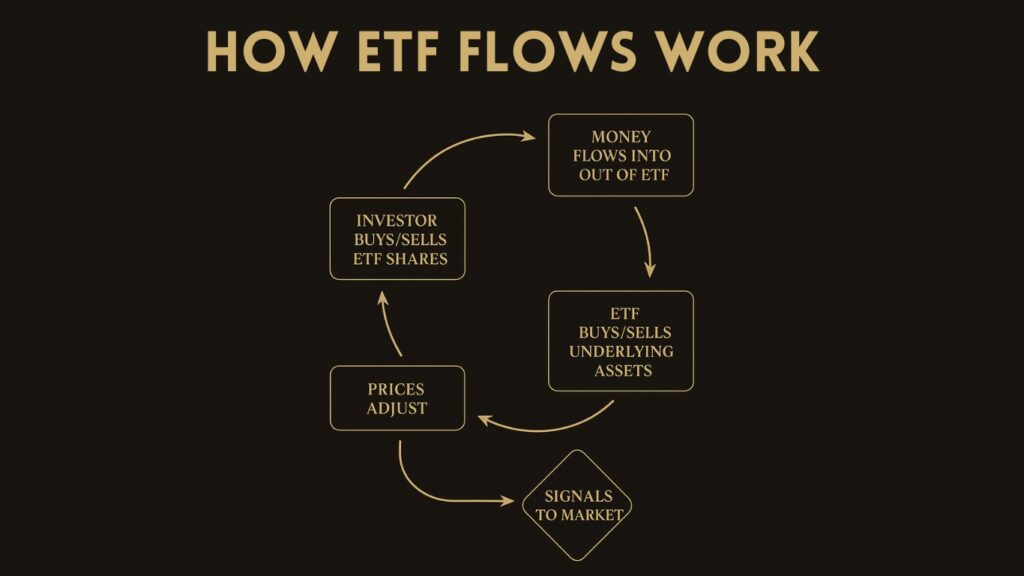
ETF flows simply show how much money is moving into or out of exchange-traded funds over a certain period. When people or institutions buy shares of an ETF, money flows into that fund. When they sell, money flows out. By tracking these flows across different funds, you can see which areas of the market are gaining popularity and which are losing favor.
For instance, if large sums are flowing into ETFs that focus on technology stocks, it suggests investors are growing more confident about the tech sector. On the other hand, if there are steady outflows from bond ETFs, it could mean investors expect interest rates to rise, making existing bonds less attractive.
It’s important to note that ETF flows are measured in net terms—meaning inflows minus outflows.
If an ETF sees $5 billion come in and $2 billion go out during the same period, the net flow is $3 billion in. Analysts track these net flows daily, weekly, and monthly to spot patterns.
Why does this matter?
Because ETFs have become one of the main tools investors use to quickly shift money between markets or strategies. Whether it’s moving into emerging markets, pulling money out of small caps, or chasing the latest megatrend like clean energy, ETF flows make these moves clear. That gives everyone else a glimpse of what the big players are doing.
Types of ETF Flows
When people talk about ETF flows, they often group them into different types based on what they reveal. Understanding these types makes it easier to figure out what’s really going on behind the scenes.
Sector and Industry Flows: These show where money is moving among different parts of the stock market. For example, if there’s a big inflow into healthcare ETFs and an outflow from energy ETFs, it suggests investors believe healthcare will perform better in the near future. This type of flow is one of the most closely watched because it highlights sector rotation—when investors move money from one sector to another to try to catch better returns.
Asset Class Flows: These track money moving between broad categories like stocks, bonds, commodities, or real estate. In early 2025, for instance, equity ETFs saw about $460 billion in net inflows, while bond ETFs pulled in roughly $300 billion. This mix tells you whether investors are chasing growth (equities) or looking for safety and income (bonds).
Regional Flows: ETF flows can also show where investors want geographic exposure. For example, global data from Q1 2025 showed strong inflows into European equity ETFs—up 28% compared to the same period last year—driven by improving economic data and lower energy prices. Meanwhile, emerging market flows were more mixed, with some countries seeing outflows due to political risks.
Thematic and Strategic Flows: These are flows into ETFs that follow specific trends or strategies, like clean energy, artificial intelligence, or dividend growth. In 2024, thematic ETFs attracted nearly $270 billion globally, reflecting how investors use ETFs to bet on long-term stories.
Defensive vs. Risk-On Flows: Another way analysts look at flows is by comparing money moving into “defensive” areas (like utilities or consumer staples) versus “risk-on” plays (like tech or small caps). For example, when money floods into low-volatility ETFs, it often signals rising caution in the market.
By breaking down flows this way, you can see not just where money is going, but also why.
How ETF Flows Reflect Investor Sentiment
ETF flows are one of the clearest windows into what investors are thinking and feeling about the markets. When big sums of money start pouring into certain ETFs, it usually means investors are either chasing opportunity or seeking safety. Either way, it’s a real-time signal of sentiment that’s hard to ignore.
Take 2024 and early 2025 as an example. As inflation pressures eased and central banks hinted at cutting rates, money started moving out of defensive sectors like consumer staples and into growth areas like technology and industrials.
In fact, global tech-focused ETFs saw over $120 billion in net inflows in 2024 alone, the highest for any sector. This showed that investors were becoming more confident about the economic outlook.
ETF flows can also reveal fear. In times of uncertainty—like during geopolitical flare-ups or surprise economic data—investors often rush into bond ETFs or funds that hold gold. For instance, in just two weeks during March 2025, U.S. Treasury ETFs gathered nearly $25 billion, reflecting investors’ quick move to protect their portfolios.
There’s also the “crowded trade” angle. Sometimes huge inflows into a specific area can be a warning sign that too many investors are on the same side of the boat.
This can make markets fragile if the story changes and people all try to get out at once. For example, during the big AI boom in late 2024, flows into AI-themed ETFs surged by over 150% compared to the previous year, raising concerns among some analysts that these trades were getting overheated.
Because ETFs are so widely used by institutional investors—like hedge funds and pension funds—the flows often reflect decisions by professionals who have deep research teams and fast information. Watching where this money is going gives individual investors clues about the market’s overall mood.
In short:
- Heavy inflows into riskier ETFs = growing optimism or “risk-on” mood.
- Surges into bonds, gold, or defensive sectors = rising caution or “risk-off” mood.
- Extreme flows into popular themes = watch for potential reversals if sentiment shifts.

How to Analyze ETF Flows
Knowing that ETF flows can reveal investor sentiment is powerful, but the real value comes from learning how to analyze these flows yourself. The good news is, it doesn’t require complicated tools—just a clear process and attention to a few key details.
1. Look at Net Flows Over Time: Start by tracking net inflows and outflows over different periods—daily, weekly, monthly, and quarterly. Large, sustained inflows into a sector ETF often point to growing confidence. For example, seeing consistent net inflows into financial ETFs over three straight months might suggest investors believe interest rates or loan growth will help banks’ earnings.
2. Compare Flows to Total Assets: A $500 million inflow sounds impressive, but it matters more if the ETF only has $2 billion in total assets versus $50 billion. By looking at flows as a percentage of an ETF’s total assets, you get a much better sense of how significant the move is.
This is often called the flow-to-AUM ratio. A spike above 5% in a week can indicate a meaningful shift in investor positioning.
3. Watch for Unusual Spikes: Sudden surges in flows—up or down—often signal a change in sentiment or a reaction to fresh news. For instance, in early 2025, a surprise rate cut by the European Central Bank led to $18 billion in new money flowing into European equity ETFs in just two weeks, showing how fast investors reposition.
4. Pay Attention to Themes: Flows into thematic ETFs, like those tied to clean energy, robotics, or AI, can highlight where investors see long-term opportunity. Tracking these can help spot big trends early.
5. Check Cross-Asset Flows: It also pays to see how flows move between stocks, bonds, and commodities. If money is leaving equity ETFs and moving into bond ETFs at the same time, it’s usually a caution flag for the stock market.
6. Use Flow Dashboards and Summaries: Many financial sites and research platforms provide free or subscription-based ETF flow dashboards. These break down where money is moving by region, sector, or asset class. Watching these summaries each week makes it easier to spot the bigger picture without getting lost in daily noise.
By following these simple steps—tracking net flows, measuring them relative to fund size, watching for spikes, and seeing where the money goes across markets—you can start using ETF flows as a real part of your investment research.
Pros & Cons of Tracking ETF Flows
Keeping an eye on ETF flows can be a smart way to understand where the market is heading, but like any tool, it has strengths and weaknesses.
| ✅ Pros | ❌ Cons |
|---|---|
| ✅ Shows real money moves: ETF flows reveal actual buying and selling, not just opinions or forecasts. | ❌ Can lag prices: Often by the time flows are large, prices have already moved. |
| ✅ Highlights big investor trends: Because ETFs are used by institutions, flows often show where professional investors are positioning. | ❌ Sometimes misleading: Big inflows might be driven by short-term traders, not long-term conviction. |
| ✅ Easy to track: Many platforms publish flow data daily and weekly, making it simple to monitor. | ❌ Doesn’t explain “why”: Flows tell you money is moving, but not always the reasons behind it. |
| ✅ Helps spot sector rotation: Watching flows can reveal when investors shift from one sector to another, like from tech to energy. | ❌ Prone to short squeezes or herding: Sharp inflows can create crowded trades that quickly reverse. |
| ✅ Useful for confirming market mood: A jump into defensive ETFs can back up other signs that investors are getting cautious. | ❌ May overstate impact: Big flows into large ETFs often don’t move the market much by themselves. |
ETF Trends & Forecasts (2025 – 2026)
Looking ahead, ETF flows are expected to keep growing at a strong pace through 2025 and 2026, driven by both professional and retail investors who want low-cost, flexible ways to invest across markets.
Total Assets Likely to Pass $14 Trillion: As of early 2025, global ETF assets stand at about $12.8 trillion. Based on current growth rates—roughly 15% per year—the market could easily surpass $14 trillion by late 2025 and reach near $16 trillion by the end of 2026. Much of this growth is being fueled by investors moving money from traditional mutual funds into ETFs for their lower fees and easier trading.
2. Thematic ETFs Will Keep Gaining Share: In 2024, thematic ETFs pulled in nearly $270 billion, making up about 24% of all net flows. This trend shows no signs of slowing. Sectors like AI, cybersecurity, green energy, and space exploration are attracting new ETF launches almost every month.
Analysts expect thematic ETFs could capture close to 30% of net inflows by 2026.
3. Fixed Income ETFs Growing Even Faster: Bond ETFs are seeing a surge as well. In Q1 2025, bond ETFs gathered roughly $80 billion, up 18% compared to the same quarter last year. With interest rates stabilizing, many investors are using ETFs to lock in yields without picking individual bonds. By 2026, some forecasts say global fixed income ETF assets could top $3 trillion, up from about $2.3 trillion now.
4. More Institutional Adoption: Pension funds, insurance companies, and sovereign wealth funds are steadily increasing their use of ETFs. This “institutional wave” is expected to push ETF market share even higher. By 2026, it’s estimated that 1 in every 4 dollars managed by large institutions could be in ETF structures.
Overall, the data paints a clear picture: ETFs aren’t just growing—they’re reshaping how money moves around the world’s markets. Watching ETF flows over the next two years will likely become even more important for anyone serious about spotting early market shifts.
FAQ
Can ETF flows be misleading?
A big inflow doesn’t always mean lasting interest—it could just be traders piling in for a quick trade. That’s why it helps to watch flows over longer periods and compare them to total fund size.
How can I track ETF flows?
Most large financial news sites and data platforms have ETF flow dashboards. These show net flows by day, week, month, sector, or region. Many are free or low-cost, making it easy to follow money trends without advanced tools.
Are ETF flows the best indicator of where the market is going?
They’re one of the most useful tools, but not the only one. It’s smart to combine ETF flow data with fundamentals, earnings, interest rates, and macro trends to build a clearer view.