
Liquidity risk is one of those quiet threats that can bring even a well-run institution to its knees. At its core, it comes down to a firm’s ability to meet its financial obligations when they come due, and when that ability breaks down, survival becomes the question. Recent shifts in the economy and rising interest rates have made the stakes even higher, pushing institutions to keep their assets liquid and their cash positions tight. Get this right, and you can weather almost any market storm.
Managing this risk is a constant balancing act. You need strategies that protect against shrinking interest margins and funding crises, while keeping your cash flow forecasts sharp and your risk appetite well-calibrated. Regulators are watching more closely than ever too, with bodies upholding Basel III standards stepping up supervision to prevent the kind of financial upheaval the world has already lived through once. Effective liquidity management is no longer optional. It is the baseline.
Understanding Funding and Market Liquidity Risk
Liquidity risk sits at the heart of modern finance. It describes the potential difficulties you or your institution might face when trying to meet short-term obligations, and it generally falls into two distinct categories: funding liquidity risk and market liquidity risk. Both can cause serious damage to financial health, but they play out in very different ways, especially when economic conditions tighten.
Funding Liquidity Risk
Funding liquidity risk kicks in when a company does not have enough liquid assets to cover its short-term liabilities. The result is often a scramble for external financing, usually on terms that hurt. Picture a company with a wall of debt maturing soon and not enough cash in reserve to handle it. That is exactly the scenario funding liquidity risk describes, and it can unravel fast if you are not prepared.
How you measure funding liquidity risk matters as much as knowing it exists. The most common approaches include tracking your cash conversion cycle, monitoring short-term debt ratios, and stress-testing your funding sources against adverse scenarios to see where the gaps appear.
- Current Ratio: This is the ratio of a company’s current assets to its current liabilities. A higher current ratio indicates that the company has more short-term assets available to cover its short-term liabilities.
- Cash Ratio: This measures the company’s cash and cash equivalents relative to its current liabilities, providing a more stringent test of liquidity.
Keeping funding liquidity risk in check comes down to a few core strategies. Diversifying your funding sources so you are never overly dependent on one lender or market is essential. Maintaining a buffer of high-quality liquid assets gives you breathing room. And running regular stress tests lets you spot vulnerabilities before a crisis forces your hand.
- Maintaining Liquid Assets: Companies often hold a portion of their assets in cash or other highly liquid forms to ensure they can meet obligations as they arise.
- Diversifying Funding Sources: By diversifying their funding sources—such as through bonds, equity, and bank loans—companies can reduce the risk of a liquidity shortfall.
- Cash Flow Forecasting: Regularly predicting cash flows allows companies to anticipate shortfalls and arrange financing in advance, mitigating the risk of running out of liquidity unexpectedly.
The 2008 to 2009 financial crisis made the cost of ignoring funding liquidity risk impossible to dispute. Lehman Brothers and a string of other financial institutions faced acute funding crises when credit markets froze almost overnight, leaving them unable to refinance short-term obligations. The lessons from that period still shape how the best-run institutions manage their liquidity today.
Market Liquidity Risk
Market liquidity risk is a different beast. It is the risk that you cannot sell an asset quickly without moving its price against you. When financial stress hits, buyers disappear and you may find yourself holding an asset at a stated market value that no one will actually pay. This kind of risk shows up most often in less liquid markets, think real estate, certain bond categories, or specialized financial instruments where the pool of buyers is thin at the best of times. If you want to understand how this dynamic plays out in real assets, this conversation with a financial analyst on property investing during inflation gives you a grounded perspective.
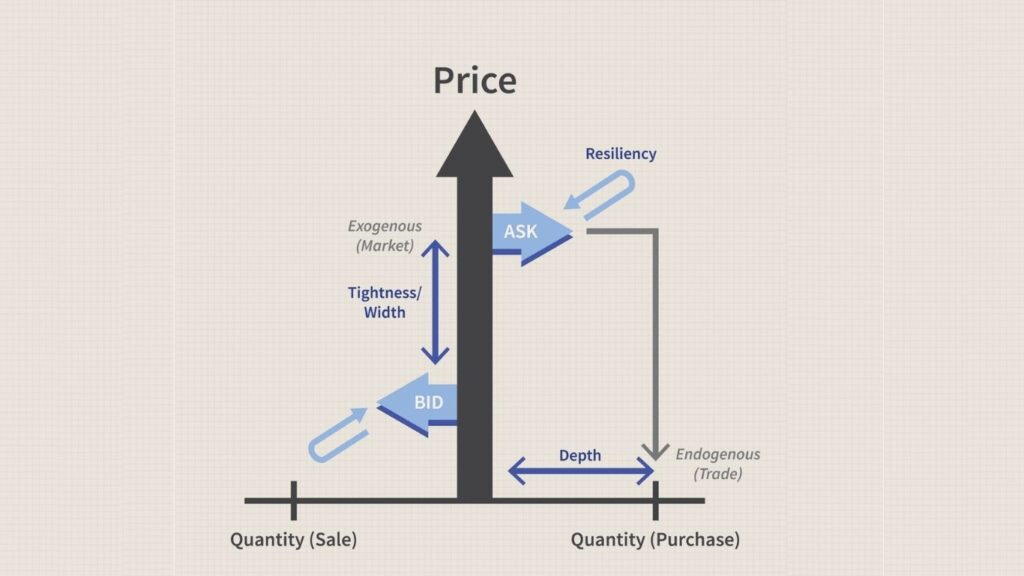
Measuring market liquidity risk involves looking at bid-ask spreads, which widen sharply when liquidity dries up. You can also track trading volumes and market depth, as thin order books are usually the first warning sign that an asset is becoming hard to exit at a fair price.
- Bid-Ask Spread: The difference between the bid price (what buyers are willing to pay) and the ask price (what sellers are asking for) can indicate market liquidity. A wider spread often signals lower liquidity.
- Turnover Ratio: This measures how often an asset is traded relative to its outstanding volume. Lower turnover can indicate higher market liquidity risk.
Mitigating market liquidity risk starts with building a portfolio that is diversified across asset classes and geographies. Avoid concentrating too heavily in illiquid positions relative to your overall book. Holding a portion of your portfolio in assets you can exit quickly gives you flexibility when markets turn against you.
- Diversifying Asset Holdings: Holding a diversified portfolio across different asset classes can reduce exposure to market liquidity risk. Assets in different sectors or markets may not experience liquidity shortages simultaneously.
- Stress Testing: Financial institutions often conduct stress tests to see how their portfolios would perform under various adverse market conditions. This helps in planning for scenarios where market liquidity might dry up.
After the financial crisis, regulators moved quickly to tighten the rules. The Basel III guidelines introduced the Liquidity Coverage Ratio, which requires banks to hold a buffer of high-quality liquid assets large enough to cover net cash outflows over a 30-day stress period. The intent is straightforward: make sure banks can survive acute stress without triggering a fire sale that makes things worse for everyone.
Managing Liquidity Risk in Practice
Good liquidity risk management is proactive, not reactive. You want to identify potential pressure points before they become emergencies. That means running regular stress tests across a range of scenarios, keeping your liquidity buffer at a level that reflects realistic worst-case outflows, and making sure your treasury team has clear protocols for escalating concerns before a small problem becomes a structural one.
- Cash Flow Forecasting: Accurately predicting inflows and outflows of cash to maintain a healthy liquidity position.
- Asset-Liability Matching: Ensuring that the duration of assets aligns with the liabilities they are intended to cover, thus reducing the risk of a liquidity mismatch.
- Stress Testing: Regularly testing the impact of extreme market conditions on the company’s liquidity position.
JP Morgan Chase is the reference point here. The bank navigated the 2008 crisis in far better shape than most of its competitors, largely because its liquidity position was strong going in and its risk management framework was built for exactly that kind of stress. Diversified funding sources and robust capital reserves gave it the flexibility to absorb pressures that crippled others. That combination of preparation and discipline is what separates institutions that survive crises from those that define them. You can see similar principles at work when examining how value investing disciplines apply to portfolio resilience.
The Relationship Between Liquidity Risk and Banks
For banks, liquidity risk is a structural feature of the business model, not an occasional concern. Banks borrow short and lend long, funding mortgages and multi-year loans with short-term deposits and market borrowings. That mismatch between asset liquidity and liability terms creates real vulnerability, especially when financial conditions tighten. Global regulatory frameworks like Basel III were built to address exactly this, introducing the Liquidity Coverage Ratio and the Net Stable Funding Ratio as the two primary tools for ensuring banks can handle both short-term shocks and longer-term funding pressure.
Liquidity Coverage Ratio and Net Stable Funding Ratio
The Liquidity Coverage Ratio requires banks to hold enough high-quality liquid assets to cover potential net cash outflows over a 30-day stress period. The logic is simple: if a short-term funding shock hits, you should be able to meet your obligations without resorting to emergency asset sales that destabilize the broader market. No fire sales, no panic, just a well-funded buffer doing its job.
The Net Stable Funding Ratio takes a longer view. It requires banks to maintain a minimum amount of stable funding relative to their assets, off-balance sheet exposures, and other commitments. The goal is a balanced funding structure that can hold up through prolonged periods of market stress, not just a 30-day window but a genuinely durable foundation.
Key Liquidity Risk Metrics
When assessing a bank’s liquidity risk, a handful of metrics do most of the heavy lifting. Two of the most closely watched are the Non-Performing Loan ratio and the Loan-to-Deposit ratio. Understanding what these numbers tell you is essential if you are evaluating a bank’s financial health or thinking about where credit risk and liquidity risk intersect. For a broader look at how financial licensing and oversight work across borders, the guide to obtaining a stock broker and forex license in Europe covers the regulatory framework in useful detail.
The Non-Performing Loan ratio, currently sitting at around 9.87%, measures the share of a bank’s loan portfolio that is in default or approaching default. A high NPL ratio signals elevated credit risk, and that credit risk has a direct knock-on effect on liquidity. When loans stop performing, expected cash inflows dry up, and the bank is left covering obligations with fewer resources than it planned for.
The Loan-to-Deposit ratio, currently at 102%, tells you how much a bank is lending relative to its deposit base. A reading above 100% means the bank is extending more credit than it holds in deposits, which creates real exposure if depositors start pulling funds. That kind of run scenario can escalate quickly, as the Financial Times has documented in its coverage of recent banking stress events.
The Interplay Between Liquidity and Credit Risk
The relationship between liquidity risk and credit risk is more nuanced than it first appears. Research covering over 4,000 non-default and 254 default U.S. commercial banks across a 12-year period shows that both risks can independently push up the probability of default. But the way they interact is not always additive. At moderate risk levels, carrying both liquidity and credit risk together can accelerate the path to default. At higher risk levels, that same combination can, somewhat counterintuitively, reduce the overall risk profile, possibly because diversification across risk types creates natural offsets within the balance sheet. It is a dynamic worth understanding if you are evaluating where your own exposure sits.


