The relationship between elections and markets has been picked apart by analysts for decades. Research stretching back to 1880 shows that when a Republican wins the presidency, equity values tend to get a 2 to 3 percent bump.
Financial markets act like political barometers, and investors watch them closely. Every shift in governance carries the potential to ripple through economic outcomes in ways you need to anticipate before they happen.
Key Takeaways
- Presidential Elections have a significant impact on the US Stock Market, shaping investor expectations and driving Market Trends.
- Election outcomes can lead to discernible Political Influence on economic indicators such as equity prices, oil prices, and currency strength.
- Historically, the election of a Republican President is associated with a noteworthy increase in equity valuations.
- Market movements around election periods reflect the investor sentiment and anticipation of Economic Consequences tied to potential policy changes.
- Understanding market responses during election cycles enables the gathering of insights into the broader relationship between politics and the economy.
- Analyzing past election impact can guide investors in strategizing for future elections.
- Over the long run, US stocks have advanced under both Democratic and Republican administrations and partisan signal is a weak guide to portfolio decisions.
- Election years tend to bring elevated short-term volatility around debates, polling shifts and the post-election transition window.
- Sector and policy expectations move sharply on election outcomes, with healthcare, energy, defense and financials usually the most exposed.
- Markets dislike contested or unclear outcomes far more than they dislike either party winning a clean majority.
- Long-term investors who reduced exposure based on political preference have historically given up meaningful return over multiple cycles.
- A disciplined investor uses election periods to stress-test sector exposure and rebalancing rules rather than to make outright directional bets.
- Who is this for?
- Long-term US-equity investors and global allocators who want a clear-eyed view of how presidential elections actually affect markets, beyond political narrative.
- What is happening?
- A historical look at US stock-market performance across presidential elections from 1933 to 2026, covering volatility, sector rotations and outcome scenarios.
- When did this emerge?
- Most relevant in election years and in the months leading up to inaugurations, when policy uncertainty tends to drive sector and macro rotations.
- Where is this happening?
- Focused on US large-cap equities tracked through the S&P 500 and Dow Jones Industrial Average, with crossover effects on global indices.
- Why does it matter?
- Political bias is a particularly expensive form of behavioural error. Historical data helps investors stay invested through political cycles they may dislike.
Historical Analysis of Stock Market Performance During Elections
The connection between presidential terms and stock market performance is far more layered than most people assume. It challenges the comfortable idea that whoever sits in the Oval Office controls your portfolio’s fate. To really understand what’s going on, you need to look at the historical data and see how different government structures have shaped election year market behavior.
Neither Republicans nor Democrats have a clean track record of consistently lifting the Dow Jones Industrial Average. The market’s growth simply does not hinge reliably on which party holds power. A Republican-led period in 2016 saw the DJIA rise about 10%.
But 2008, under Democratic leadership, saw the market crater by 26%. Those swings tell you that forces well beyond party affiliation are shaping what your investments do.

Market data going back to 1900 shows resilience and growth potential regardless of which party dominates Washington. About half of those periods unfolded under unified governments, yet major market disruptions were rarely tied directly to politics. After the 2010 split Congress, the DJIA surged 14%.
That kind of growth comes from a mix of economic forces, not just who won the last election.
Bipartisan Policies and Their Influence on Economic Growth
Bipartisan policies tend to act as a stabilizing force, bridging the gap between opposing political camps. The bipartisanship of the 1990s, for example, helped spark a 16% DJIA increase. Across different election cycles, those cooperative legislative efforts have given investors the confidence to stay the course.
When both sides of the aisle find common ground, the market tends to reward it.
Patterns of Divided Government and Market Outcomes
Pull up the historical data from 1927 to 2015 and a striking picture comes into focus. Markets averaged excess returns of 14.5% under Democratic presidents compared to 10.7% under Republicans. That gap widened sharply between 1999 and 2015, ballooning to a 17.4% annual difference.
Those are numbers worth paying attention to.

The research by Santa-Clara and Valkanov backs this up, pointing to a clear contrast in stock market performance between Democratic and Republican presidencies. But the explanation goes deeper than simple partisan politics. Electoral risk aversion plays a real role.
When economic uncertainty rises, voters tend to lean toward Democratic candidates who promise stronger safety nets, and that anticipation of higher-tax, more redistributive government gets priced into markets well before Election Day.
After financial crises, this trend sharpens. The fallout from economic turmoil often pushes voters toward left-leaning governments, drawn by promises of stronger social protections. In periods of genuine uncertainty, the odds of a Democratic win climb, and that dynamic ties risk aversion directly to market conditions and electoral outcomes in ways you should factor into your thinking.
How Presidential Elections Affect The US Stock Market
Presidential elections are pivotal moments that send real tremors through financial markets. The historical record reveals effects far more complex than simple partisan wins or losses. Despite the conventional wisdom about election-year volatility, a closer look at the data often defies what most investors expect.
Election Cycle Volatility and Investment Strategy
Since 1900, the US has seen 34 unified governments. But that kind of consolidated political power has become increasingly rare, with only six instances since 1980.
After the 2016 election, the DJIA climbed roughly 10%, riding the wave of Trump’s victory with a Republican congressional majority behind him. Flip to 2008, and the picture is completely different. Barack Obama’s election, set against the backdrop of a full-blown financial crisis, sent the DJIA plunging 26%.
These two data points alone make the case for building an investment strategy flexible enough to adapt when the political winds shift.
Comparing Market Performance Across Political Events
The stock market’s reaction to different administrations tells a genuinely complicated story. Bill Clinton’s 1992 victory with Democratic control produced a 5% DJIA increase. Yet under President George H.W.
Bush with a Democratic Congress in 1990, the market leapt 16%. Then, under Trump with a divided Congress in 2018, the DJIA fell 7%. No clean narrative fits all of it.
These variations are a reminder that political events carry nuanced and often unpredictable impacts on your portfolio. Short-term market movements tied to elections are real, but they rarely tell you much about where things are headed over the long run.

Look at the full sweep of the data. From a 14% DJIA gain during Reagan’s second term with a divided Congress to 6.5% growth under George W. Bush alongside a Democratic Congress, a clear pattern emerges.
No single party’s dominance guarantees market success. Your best move is to keep your eyes on economic indicators rather than election scorecards, both during campaign season and long after the votes are counted.
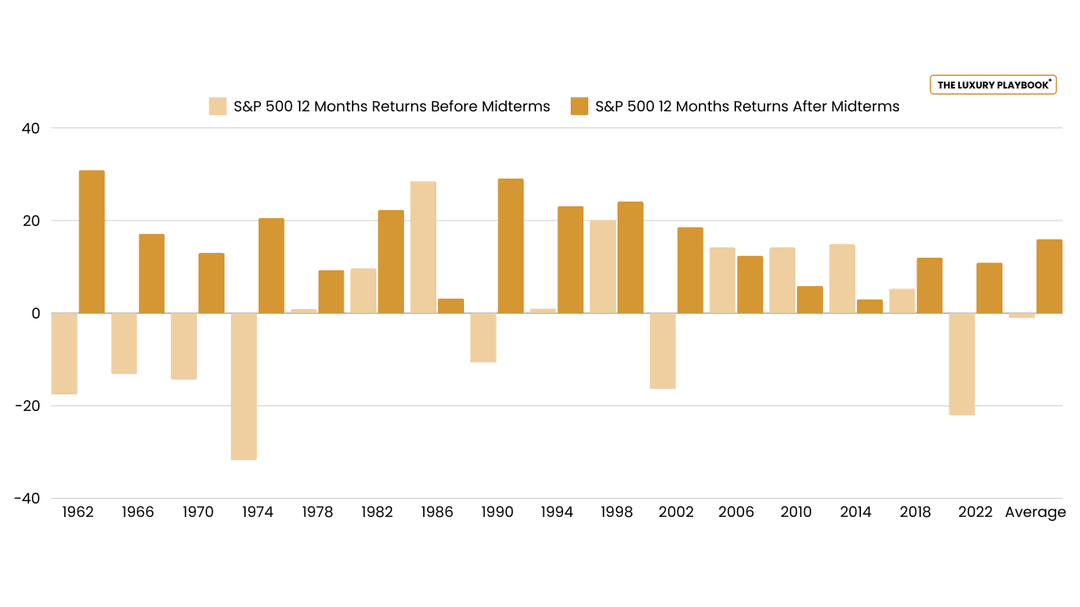
Stock Market Performance in Midterm Election Years
Midterm elections have historically produced a recognizable pattern of market activity. Even when the S&P 500 dips, like the 2.1% post-election drop seen in some cycles, the broader trend holds its ground. A short-term decline tied to political uncertainty is not a signal that the bottom is falling out.
Vanguard’s research going back to the 1800s shows that election outcomes, Republican or Democrat, leave little lasting imprint on balanced portfolios. A mix of 60% equities and 40% bonds has delivered consistent performance across wildly different political environments. That tells you your investment strategy for managing market risk should not waver just because Washington is changing hands.
Staying committed to the market over time pays off in ways that are hard to argue with. If you had missed just the 10 best market days between 1993 and 2013, your annual returns would have dropped from 9.2% to 5.4%. That is a steep price for reacting too quickly.
Staying steady through midterm election volatility, rather than jumping in and out, has historically served investors far better.
The post-midterm data is compelling. The S&P 500 has posted an average return of 16.3% in the 12 months following a midterm election. That number speaks to the market’s underlying strength, a strength that tends to reassert itself once the political noise fades and you’re focused on the fundamentals.
Markets are inherently turbulent, and that turbulence peaks around Election Day. The temptation to sell can feel rational in the moment. But rapid market moves rarely justify overhauling your entire investment approach.
Trends tend to stabilize once the dust settles, and staying invested through those cycles is usually the smarter call. Each midterm cycle offers a fresh lesson in how to read and navigate market dynamics without letting short-lived political drama derail your long-term goals.
What Investors Should Watch in the Run-up to the Election
If you’re a market-focused investor, your attention should stretch well beyond the presidential race. Congressional contests deserve just as much scrutiny. The balance of power in the House and Senate can shift dramatically, and those shifts carry real consequences for the economic and policy environment you’ll be investing in.
The presidency is only part of the equation. Senate and House races can be equally consequential for your watchlist. Pay close attention to key retirements and open seats that could tip the balance toward unified voting blocs, since those dynamics shape the economic policies that ultimately drive the indicators you care most about.
How the two parties collaborate, or fail to, after the election will set the tone for policy direction in the years ahead. The Federal Election Commission offers solid historical data on past election cycles and their market ripple effects. Knowing that history gives you an edge when positioning your portfolio ahead of the results.
For service members and citizens voting from abroad, the Federal Voting Assistance Program makes sure their voices count. Concerns about voter or election fraud fall under the jurisdiction of state officials, the Voting Section at the US Department of Justice, or local FBI offices. That oversight structure gives investors another layer of confidence in the democratic system that underpins economic stability.
Economic Metrics Influencing Stock Market Behavior
Getting a real handle on the relationship between economic metrics and stock market behavior is one of the most valuable things you can do as an investor. The data consistently shows that economic fundamentals, not political swings, drive the market’s long-term direction. Corporate earnings tell you the true health of the companies you own, and that matters far more than which party controls Congress.
Central banks set interest rates, and those rates shape everything from borrowing costs to the pace of economic expansion. Lower rates typically push the market higher by making business investment and consumer spending cheaper. Higher rates do the opposite, and you need to be positioned for both scenarios.
The data on GDP growth, adjusted for inflation, has generally favored Democratic administrations over Republican ones. That pattern extends to federal debt management, where Democrats have historically run up less debt relative to GDP. Whether you agree with the underlying policies or not, those fiscal trends have a measurable influence on how markets perform over time.
Starting with the Carter administration, two out of three Democratic presidents managed to reduce the federal debt ratio. Republican leaders, by contrast, have generally seen debt ratios climb on their watch. Wars and economic downturns complicate the picture, but the sensitivity of markets to those fiscal shifts is real and worth tracking.
Federal spending as a share of GDP has risen from post-World War II levels to somewhere in the 20 to 25% range. Federal receipts, on the other hand, held steady around 17% until the 1970s. That persistent gap between what the government takes in and what it spends is one of the most consequential forces shaping market performance over the long run.
All of this points to one core truth. Economic metrics are your most reliable compass for navigating investment decisions. By anchoring your strategy to the fundamentals rather than political headlines, you build a more stable and informed approach to growing your wealth.

Tips for Investors During Election Season
Since 1950, US stocks have posted an average gain of 9.1% in election years. And the S&P 500 has delivered positive returns in 83% of election years going back to 1928. Those numbers make a strong case for staying the course rather than pulling back when political uncertainty spikes.
Fewer instances of ticket-splitting in Congress can influence outcomes at the margins, but that effect should not be overblown in your decision-making.
- Divided government has often led to stronger market returns, showcasing the complex relationship between politics and economic performance.
- Data refutes the idea that one political party benefits the market more, as the S&P 500 has shown positive returns in almost all political scenarios.
- Strategic Advisers, LLC, advises against adjusting investment strategies based on election outcomes alone, emphasizing the importance of market fundamentals.
An Investopedia survey found that 61% of investors were worried about the 2024 presidential election affecting their portfolios. That anxiety is understandable, but a sound long-term strategy means resisting the urge to make hasty changes based on election forecasts. Speculation tied to political outcomes tends to introduce more risk than it mitigates. And notably, nearly half of all investors surveyed said market performance matters more to their portfolios than election results, which says a lot.
| Election Year | Average S&P 500 Return | Market Performance in Election Years | Investor Concerns (% worried about election impact) |
|---|---|---|---|
| Since 1950 | 9.1% | Generally Positive | 61% (2024 projection) |
| Since 1928 | 11.58% | Positive in 83% of Years | 68% Republicans 57% Democrats (Immediate and lasting impact) |
The bottom line is this. Election impacts on the stock market are worth understanding, but they should not be the centerpiece of your investment thesis. Focusing on economic and market fundamentals, the approach endorsed by most serious advisors, gives you a strategy durable enough to weather any political climate.
Specific Stock Market Sectors to Watch in Election Years
For active managers, sector dynamics during election years deserve serious attention. The average sector’s market capitalization dwarfs that of individual stocks, which opens up meaningful opportunities for informed positioning. That said, data since 1990 shows that only about 22% of overall market dispersion is actually driven by sector differences.
Sectors matter, but they are not the whole story.
Within the S&P 500, elections tend to amplify the differences between sectors. That pattern showed up in 71% of presidential election months. Congressional elections told a similar story, with 63% of those periods showing elevated cross-sector volatility, slightly less pronounced but still worth watching.
November, the election month, is when sector volatility tends to peak. Mid and small-cap companies feel that turbulence most acutely. In fact, congressional elections in November have historically produced even greater cross-sector dispersion than presidential elections, which is a detail most investors overlook.
Stock Market Trends in Relation to Election Outcomes
Election years carry a recognizable fingerprint in the historical market data. Studies consistently show that stock market volatility runs higher during election years than in off-years. The uncertainty around the outcome, combined with the potential for sweeping policy changes that reshape entire industries, is enough to keep even seasoned investors on edge.
The election’s influence on markets does not stop when the votes are counted. Some research points to the year following a presidential election as a period of above-average market performance. Markets tend to price in the potential for pro-business policies and a more predictable governing environment once the winner is clear.
That said, these patterns are tendencies, not guarantees, and there are plenty of historical examples where markets went their own way regardless of what the political calendar suggested.
Making sound investment decisions through an election period means keeping several things in mind at once. A long-term strategy should anchor everything you do, since short-term predictions tied to electoral outcomes are notoriously unreliable. Broad diversification across sectors, paired with a well-balanced portfolio, gives you the cushion to absorb any election-related turbulence without derailing your broader financial goals.
You can also explore the key differences between investing and speculating to make sure your election-year moves stay on the right side of that line.
Understanding Market Response to Election Surprises
In 2004, markets had already priced in expectations of higher stock values, rising interest rates, and elevated oil prices if President Bush was re-elected over Kerry. When exit polls started rolling in on Election Day, the resulting volatility was sharp and fast. One specific security betting on a Bush victory dropped from $5.50 to $3 on the strength of those early polls, then rocketed to $9.50 as the actual vote count told a different story.
That episode is a masterclass in how quickly sentiment can swing when election surprises hit.
Long-term vs Short-term Investor Reactions to Election News
The immediate market reaction to election results can look dramatic in the moment. But zoom out and the picture steadies considerably. Bloomberg’s long-run market analysis aligns with research stretching back to the 1880s, showing that the election of a Republican president typically lifts stock values by 2 to 3%. That finding is a useful reminder of the gap between short-term election anxiety and the more durable arc of long-term market growth.
Keeping that distinction clear in your mind is what separates disciplined investors from reactive ones.
Getting a firm grip on these market and political dynamics is essential for building a sound economic perspective. Your focus should stay on long-term gains rather than getting pulled into the noise of short-term returns. That discipline, anchored in clear-headed market analysis, is what allows you to navigate electoral uncertainty without losing sight of where you actually want to end up.

Positioning Investments for Post-Election Stock Market
Once an election year wraps up, a calm and strategic approach is exactly what the moment calls for. The S&P 500 tends to inch up just 0.3% in the lead-up to a midterm, reflecting the cautious mood among investors holding their breath. But historically, it has surged an average of 16.3% in the year after.
That post-election growth pattern is a strong argument for playing the long game rather than chasing short-term bets.
Political uncertainty makes investors skittish, and market withdrawals have historically tripled during election years. But pull back and look at the broader sweep of history. Markets have advanced in 20 of the last 24 presidential cycles, an 84% success rate that is hard to argue with.
That track record underlines the case for diversification and cautions against making sudden portfolio changes based on political forecasts. With sector performance varying widely, a balanced approach is your most reliable path through the volatility. Some high-net-worth investors are also shifting portions of their capital to private equity as a way to reduce their exposure to public market swings during politically charged periods.
Cash, government bonds, and precious metals tend to act as anchors during market turbulence. They may not fit an aggressive growth strategy, but they highlight why a varied portfolio matters. Factors like China’s GDP trajectory, wage inflation, and consumer sentiment will all shape the economic environment in the years ahead.
Recognizing those inputs helps you build an investment strategy that accounts for both global and local forces. Even with political uncertainty in the mix, a well-diversified, quality-focused portfolio has the resilience to weather whatever the post-election market throws at it. The Financial Times has consistently tracked how global macro factors intersect with US electoral cycles, and it is worth keeping that perspective close as you refine your positioning.
We last reviewed this analysis in May 2026.
![]()

Alex Tzoulis
Alex Tzoulis is Co-Owner and Markets Analyst at The Luxury Playbook, specializing in equities, crypto, forex, and global financial markets. His work focuses on analyzing macroeconomic trends, geopolitical developments, and monetary policy, translating them into actionable insights across both traditional and digital asset classes. He leads the platform's financial market coverage, providing structured analysis across stock market investing, trading strategies, and cryptocurrency markets. His expertise strengthens the publication's authority in financial markets and capital allocation, bridging traditional finance with emerging digital investment ecosystems.