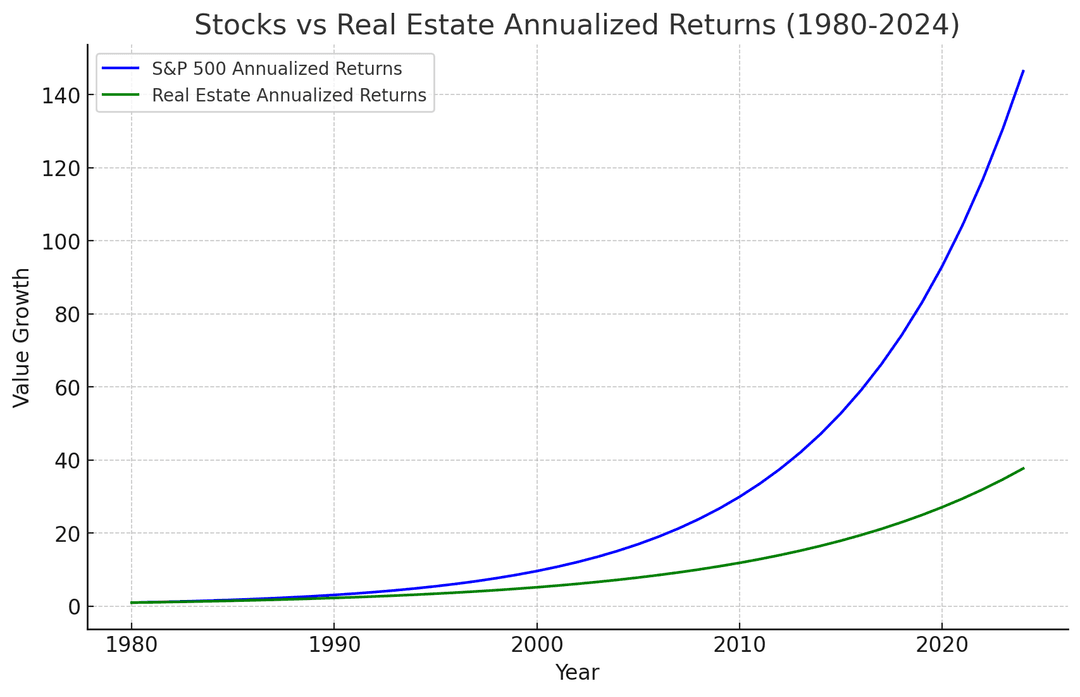
Historically, stocks have outperformed real estate by a meaningful margin. The S&P 500 has delivered an average annual return of around 10%, climbing to about 12% once you factor in dividends. Real estate, by comparison, has generally returned somewhere between 4% and 8% annually, with growth that only slightly outpaces inflation.
Look at the last decade alone. From 2014 to 2024, the S&P 500 surged by 313.7%, while the Vanguard Real Estate Index gained just 42%. That gap tells you a lot about the different trajectories these two asset classes can take over time.
That said, each asset class brings its own strengths to the table. Real estate gives you tax advantages, a tangible asset you can see and touch, and a relatively stable, less volatile store of value that tends to hold its own against inflation.
Stocks, on the other hand, carry higher growth potential but bring real volatility along for the ride. You can win big, but you have to be comfortable with the swings.
- Public equities have produced higher unlevered long-run returns than residential real estate in most developed markets over long horizons.
- Once mortgage leverage and tax treatment are layered on, real estate often matches or exceeds equities on a levered basis for owner-occupied investors.
- Real estate carries materially lower price volatility but also lower liquidity, with transaction costs measured in percent rather than basis points.
- Equities outperform real estate in periods of strong productivity growth, while real estate tends to outperform during inflation surprises.
- Income reinvestment matters in both cases, with rents and dividends together explaining a large share of total return across decades.
- For HNW investors, the right answer is rarely either-or, and the blend is what determines portfolio efficiency over a full cycle.
- Who is this for?
- Investors and family offices comparing equities and real estate inside their long-term allocation and trying to size each correctly.
- What is happening?
- We are pulling the long-run historical data on equities and real estate and showing where each format actually wins.
- When did this emerge?
- The comparison draws on a multi-decade window that covers several full credit and macro cycles in major developed markets.
- Where is this happening?
- The data set is anchored in US returns, with parallel evidence pulled from the UK, parts of Europe and developed Asia.
- Why does it matter?
- A disciplined view of historical returns prevents the recency-driven swings between asset classes that erode multi-generational wealth.
Historical Performance of the Stock Market
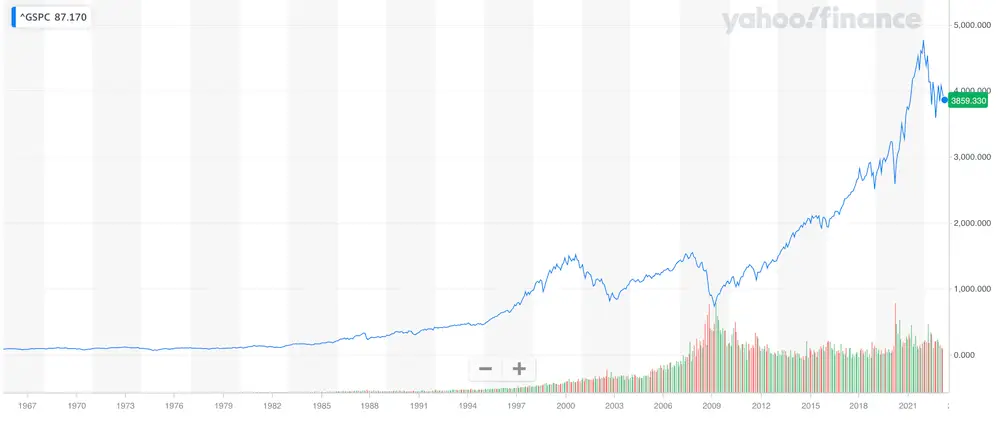
We anchor our long-run equity figures to S&P index data and the St. Louis Fed (FRED) time series, which together provide the cleanest read on real total returns since 1928. Both datasets are revised periodically, so we treat any single annualized number as a directional signal rather than a precise forecast.
Recent macro commentary from Bloomberg and the Financial Times reinforces the point that headline index returns sit on top of dividend reinvestment and earnings growth. We watch all three layers when we evaluate an entry point.
The stock market is one of the clearest windows into the health of the broader economy, and the S&P 500 is the index most investors watch most closely.
Studying its history gives you a sharper instinct for balancing risk against reward. The patterns are there if you know where to look.
Stock Market Volatility and Returns
- Long-Term Average Annual Return: Between 1978 and 2024, the S&P 500 achieved an average annual return of approximately 12.25%.
- Recent Decade Growth: From 2013 to 2024, the index experienced a cumulative growth of about 404.47%, equating to an annualized return of 14.66%.
That long-run growth doesn’t come without turbulence. Inflation, interest rate shifts, geopolitical shocks, and corporate earnings surprises can all send the index into sharp moves in either direction. Understanding those drivers is part of investing well.
When you include dividends, the annualized return of the S&P 500 over extended periods reaches around 14.66%. That’s a number worth paying attention to.
Dividends aren’t an afterthought. Reinvested over decades, they compound into a substantial share of your total gains, which is why total return matters far more than price appreciation alone.
Key Stock Market Indices
Different indices measure different slices of the market, and the historical record is illuminating. Small-cap stocks have outrun large-caps over the long haul, averaging around 12.1% annually from 1928 to 2024. Over that same stretch, U.S. home prices rose by about 5.4% per year.
The gap in growth potential is hard to ignore.
| Index | Annualized Return | Period |
|---|---|---|
| S&P 500 | 11.9% | 1928-2023 |
| Treasury Bills | 3.3% | 1928-2023 |
| Small-Cap Stocks | 12.1% | 1928-2023 |
| Vanguard Real Estate Index | 7.0% | 2013-2023 |
Historical Performance of the Real Estate Market
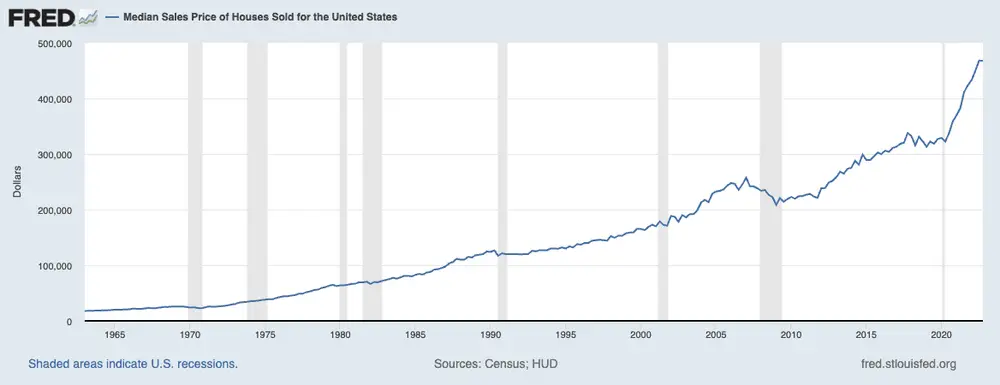
For housing benchmarks we lean on the FRED Case-Shiller series alongside the Knight Frank Wealth Report prime residential index. The combination keeps us honest about the gap between national averages and the top tier of the market.
Real estate has its own distinct story, and it looks quite different depending on whether you’re looking at residential or commercial property.
Since 1965, residential property values have climbed well ahead of income growth. When you add rental income into the calculation, the average annual return reaches 10.6%. That makes real estate a credible inflation hedge and a genuine source of long-term appreciation.
Those figures assume no leverage, which is worth noting since most real estate investors do use borrowed capital. On the commercial side, NCREIF data puts average annual returns at a steady 9.5%, underscoring the consistency that draws institutional money into commercial property.
Residential vs. Commercial Real Estate Returns
From 1991 to 2024, U.S. single-family homes appreciated at an average annual rate of roughly 4.3%. Solid, but not spectacular.
Commercial real estate told a different story over the same period, delivering average annual returns of about 9.5%. Population growth, rising homeownership rates, and inflation-driven appreciation all fed residential gains, while commercial properties spanning office buildings, retail spaces, industrial facilities, and warehouses benefited from strong occupier demand and long-term leases.
Real estate also moves in cycles, and those cycles matter enormously to your returns. Expansion phases can be very rewarding. Contraction phases can be painful.
The 2007 to 2008 housing crash is the starkest recent example. Property values collapsed, and plenty of investors who thought real estate was a safe haven were caught off guard. The lesson is clear: real estate isn’t immune to downturns, and its returns tend to track inflation closely, preserving value without always beating it by a wide margin.
Geographical Variations in Real Estate Performance
Where you buy matters as much as what you buy. Local economic conditions, regional policy, and supply constraints all drive wildly different outcomes across markets. Cities like New York or San Francisco have historically delivered far stronger appreciation and rental income than rural markets.
If you want to understand what shapes those differences, tracking emerging real estate markets alongside established ones gives you a useful benchmark.
| Aspect | Residential Real Estate | Commercial Real Estate |
|---|---|---|
| Annual Returns (1965-Present) | 9.7% (including rental income) | 9.03% |
| Market Volatility | Moderate | Lower |
| Growth Rate (1980-2023) | 8.6% | 9.2% |
| Impact of Real Estate Cycles | Significant (e.g., 2007-2008 crash) | Steady performance |
| Geographical Influence | High (varies by region) | Present (location-dependent) |
Comparing Returns: Real Estate vs Stock Investing
Over the long run, the S&P 500 has delivered stronger returns than real estate, driven primarily by the compounding power of equity growth. The index has averaged around 10% annually over extended periods, with that figure climbing to roughly 12% between March 1980 and September 2023. Factor in reinvested dividends and you’re looking at over 14% per year.
For investors focused on maximum long-term growth, finding the right stock market tools to ride those gains is worth the effort.
Real estate has put up respectable numbers too, just not at the same pace. The annualized growth rate for real estate investments over that same stretch came in at 8.6%. Still meaningful, but consistently trailing equities.
What real estate lacks in explosive upside it partly makes up for with leverage, tax advantages, and the steady cash flow that rental income provides, which can make it the smarter play depending on your personal strategy and goals.
Liquidity is another factor you can’t ignore. Stocks let you move in and out of positions in seconds. Real estate locks up your capital, often for years.
That illiquidity can be a disadvantage in a downturn, but it also keeps you from making emotional decisions. Rental yields provide a predictable income stream that stock dividends don’t always match. And for many serious investors, building a portfolio that holds both asset classes is the smartest way to balance growth with stability.
The 145-Year Study
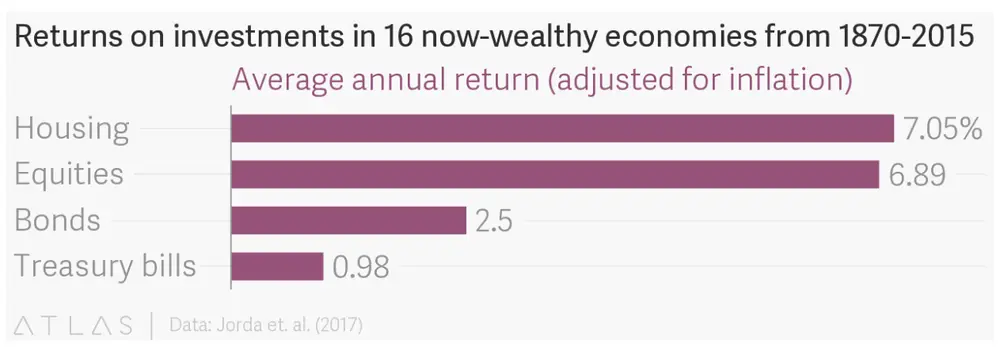
A team of economists from the University of California Davis, the University of Bonn, and the German central bank set out to settle the debate once and for all, working through a remarkable dataset spanning 145 years.
The lead authors, Oscar Jorda, Katharina Knoll, Dmitry Kuvshinov, Moritz Schularick, and Alan M. Taylor, published their findings in a paper titled “The Rate of Return on Everything, 1870 to 2015.” They examined 16 advanced economies across those 145 years, comparing returns across equities, residential real estate, short-term treasury bills, and longer-term treasury bonds.
To make the comparison as clean as possible, they adjusted every asset class for inflation and included all forms of return, not just price appreciation. Dividend income counted for equities. Rental income counted for residential real estate.
Their conclusion might surprise you. Residential real estate came out on top, averaging just over 7% per year. Equities weren’t far behind, landing just under 7%.
Bonds and bills trailed far behind, which surprised no one.
Risks Associated with Stock Market Investing
Stock market investing can be genuinely thrilling, but the risks are real. Volatility is the one that catches most investors off guard. The S&P 500 has posted dramatic swings throughout its history, and no bull market lasts forever.
Even a period as strong as 1980 to 2023, which delivered roughly 12% annually, was punctuated by brutal drawdowns along the way.
Managing that volatility is the real challenge. Economic cycles, central bank decisions, and global events can trigger sharp corrections that test even experienced investors.
Investor sentiment and corporate earnings add another layer of unpredictability. And while true crashes are rare, when they do happen, the damage to a portfolio can be severe.
Even in generally positive periods, the stock market can make sharp, disorienting moves. The macro environment plays a huge role, and you need to be ready for it.
Small-cap stocks illustrate this tension well. They’ve delivered an average annual return of around 12.5% from 1968 to 2022, but with meaningfully higher volatility than large-caps. The potential reward is real, and so is the risk.
Staying informed is non-negotiable. Watching global economic developments, central bank signals, and sector-specific news gives you a better chance of navigating the inevitable turbulence. Smart risk management isn’t optional in equity investing.
It’s the whole game.
Risks Associated with Real Estate Investing
Real estate can generate impressive returns, but it carries its own set of risks that are very different from what you face in the stock market. Understanding your exit options before you enter a deal is one of the most important things you can do as a real estate investor, because illiquidity means mistakes are expensive and slow to unwind.
- Market Liquidity and Asset Liquidity: Real estate lacks market liquidity, making it harder to sell properties quickly compared to stocks. Selling can take weeks or even months, posing challenges during financial emergencies or market downturns when rapid access to capital is needed.
- Maintenance and Management Costs: Real estate investments come with ongoing costs for maintenance, repairs, and tenant management. These expenses, which include property upkeep, periodic renovations, and dealing with tenant-related issues, can erode profit margins if not planned and budgeted effectively.
- Legal and Regulatory Risks: Real estate investors must navigate complex zoning laws, building codes, and tenant rights regulations. Non-compliance or sudden regulatory changes can lead to fines, legal complications, or increased operational costs, significantly affecting the profitability of investments.
- Market Volatility: Real estate markets are subject to cyclical trends and economic conditions. Property values and rental demand can be heavily influenced by factors such as local employment rates, interest rates, and overall economic stability. Market downturns in specific regions can have a prolonged negative impact on returns.
- Financing Risks: Many real estate investors rely on mortgages or financing, which exposes them to interest rate fluctuations. Rising mortgage rates can increase loan repayment costs, reduce profitability, or make refinancing less viable, creating additional financial pressure.
- Geographic Risks: Location plays a critical role in the success of real estate investments. Properties in areas with declining populations, poor infrastructure, or economic stagnation may struggle to maintain their value or attract tenants, leading to lower returns over time.
| Risk Category | Description |
|---|---|
| Market Liquidity | Longer time frames required to sell properties compared to stocks. |
| Maintenance Costs | Ongoing expenses for property upkeep and tenant management. |
| Regulatory Risks | Compliance with laws and regulations, which can impact operations. |
| Market Volatility | Economic cycles and downturns can significantly impact property values. |
| Financing Risks | Mortgage rate changes can increase costs or reduce profitability. |
| Geographic Risks | Location-dependent factors may affect property appreciation and demand. |
Case Studies: Stocks vs Real Estate Historical Returns
Looking at how both asset classes have behaved during major economic shocks gives you a much clearer picture than averages alone. The crises tell the real story.
The Great Recession of 2008
The 2008 Great Recession hit both markets hard, but in different ways. Real estate took the direct blow, with property values collapsing under the weight of overleveraged borrowers and fundamentally flawed mortgage practices. The stock market amplified the damage, with equities selling off sharply as the financial system teetered.
The two markets were more intertwined than most investors had realized, and that lesson has shaped how serious money thinks about diversification ever since.
The Dot-Com Bubble
When the Dot-Com Bubble burst in the early 2000s, it exposed just how dangerous speculative excess in equities can become. The tech sector took the worst of it, but the fallout spread broadly, wiping out enormous amounts of paper wealth. Real estate came through that period in far better shape, which reinforced the idea that the two asset classes don’t always move together. Bloomberg’s historical market data captures just how severe the equity losses were during that stretch.
The Housing Market Boom and Bust (1990 to 2006)
The period from 1990 to 2006, often called the Great Moderation, saw housing outperform equities for a sustained stretch. But the bust that followed was severe. Overvaluation and reckless lending practices created a correction that wiped out years of gains for many property owners.
The stock market, by contrast, has historically delivered steadier compounding over long periods, even if individual years can be rough. The Financial Times has extensively documented how that cycle reshaped investor attitudes toward real estate as an asset class.
What these historical episodes have in common is the lesson they teach about risk and timing. Whether you’re in stocks, real estate, or both, knowing how different financial shocks tend to play out helps you build a strategy that can weather the inevitable downturns. Forbes has tracked decades of investor behavior through these cycles, and the pattern is consistent: the investors who understand history are the ones who come out ahead.
FAQ
What makes more millionaires stocks or real estate?
Historically, real estate has created more millionaires than stocks. This is largely due to the leverage involved, people can use mortgages to buy real estate with a fraction of the total value, allowing for significant returns on a smaller initial investment.
Real estate also offers cash flow opportunities (rent), tax benefits, and long-term appreciation. On the other hand, stocks require more upfront capital for substantial gains and are subject to higher volatility.
We last reviewed this analysis in May 2026.
![]()

Stefanos Moschopoulos
Stefanos Moschopoulos founded The Luxury Playbook in Athens and has spent the better part of a decade following the auction calendar, the en primeur releases, and the watchmakers, gallerists, and shipyards the magazine covers. He writes the field guides and listicles that anchor the Connoisseur section — pieces built on Phillips and Christie's results, Liv-ex movements, and conversations with collectors he has met across Geneva, Bordeaux, Basel, and Monaco. His own collecting habits sit closer to watches and wine than art, and it shows in the level of detail in the magazine's coverage of those categories. Under his direction, The Luxury Playbook now publishes long-form field guides, market-defining year-end listicles, and the Voices interview series with the founders behind the houses and the brands.