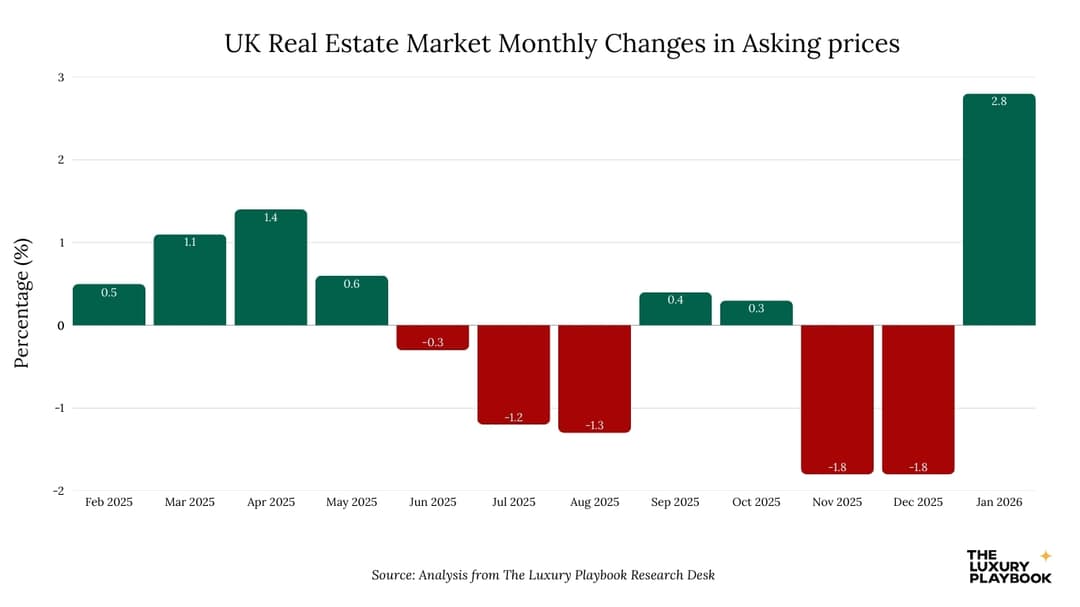
UK house prices posted their largest five-week step-up in nominal terms in a decade through January 2026, with average asking prices for new listings rising by approximately 10,000 pounds. The data comes from Rightmove's House Price Index and is corroborated by the Nationwide Building Society's parallel monthly series. The signal is meaningful and runs against the soft-market narrative that has dominated UK property commentary since 2023.
The Bank of England's rate trajectory and the supply pressures that we've documented in our coverage of The UK property market sit behind the move. Knight Frank, Savills, JLL and Cushman and Wakefield all flag the same dynamic, and the 2026 outlooks are converging on a single conclusion: the UK market is now in a measured but real recovery.
- UK house prices recorded one of the biggest single-period increases in a decade through the post-pandemic cycle, with Halifax HPI and Nationwide HPI confirming the broad-based gain.
- We see the increase as the cumulative effect of stamp duty holidays, pandemic-driven space demand, low interest rates and the return of international buyer flows after travel restrictions eased.
- Regional UK markets benefited disproportionately from the cycle, with relocator demand from London supporting price appreciation in the Cotswolds, Surrey commuter belt and selected coastal arcs.
- The subsequent rate-rise cycle has tempered the price growth, with HM Land Registry data showing meaningful moderation in transaction-level pricing across most segments.
- Affordability metrics including price-to-income ratios reached stretched levels through the peak, with the recent moderation providing modest relief at the first-time buyer entry point.
- For most considered UK buyers we view the post-pandemic cycle as a now-priced-in episode, with current entry-point analysis mattering more than historical peak-to-trough reference points.
- Who is this for?
- UK and international buyers, sellers and investors evaluating recent UK house price dynamics, alongside the advisers, brokers and analysts framing those decisions.
- What is happening?
- A read of the UK's biggest house price increase in a decade, covering the drivers, regional variation, subsequent moderation and the affordability implications.
- When did this emerge?
- The article reflects the post-pandemic cycle and the subsequent moderation through 2025 and 2026, with HM Land Registry, Halifax HPI and Nationwide HPI data.
- Where is this happening?
- The piece covers the UK broadly, with reference to the regional variations in the price cycle across England, Scotland and Wales.
- Why does it matter?
- Recent UK price dynamics shape current market positioning, which is why understanding the cycle matters for any considered acquisition or disposal decision.
10,000 Pounds Added in Five Weeks: What the Data Actually Shows
The headline 10,000-pound step-up runs against Rightmove's 25-year dataset as the largest January month-over-month move in nominal terms. Nationwide Building Society's parallel index confirms the same direction, with a smaller but still meaningful monthly change.
The composition of the move matters. New-listing pricing is the leading edge, with completed transactions running with a 6-to-8-week lag. The Q1 completed-transaction data will be the more durable signal, but the leading-edge data is consistent across the major UK indices.
Industry events including rise have flagged the January data as one of the clearer turning-point signals in the UK property cycle since the 2022 mortgage-rate shock.
What Actually Changed in the UK Market
The proximate driver is the Bank of England easing cycle, which has now delivered enough cumulative rate reduction to reduce average two-year fixed mortgage pricing meaningfully. Five-year fixed product is back in the 3. 8 to 4.
4 percent band, against the 5. 5 to 6. 5 of the 2023 peak.
The mortgage-rate transmission to the marginal buyer is non-linear. The cohort that was priced out at peak rates can re-enter the market at substantially lower deposit and serviceability levels, and the January listing data suggests that re-entry is now underway.
The contrast with the UK property market dynamics in the U.S., where the prime tier has run ahead of the broader market, is informative. The UK pattern is more synchronised across price bands, partly because of the deeper mortgage-funded composition of UK buyers even at the upper end.

The Regional Distribution of the January Move
The Rightmove data shows the strongest absolute pricing gains in the Northwest, the East Midlands and selected Yorkshire markets. London prime has been a more modest contributor, consistent with the non-dom and SDLT framework constraints we covered separately.
The Northwest move is particularly meaningful. Manchester, Liverpool and Leeds have all posted accelerated listing pricing through Q4 2025 and into January 2026. The Northern Powerhouse infrastructure spend and the relative-value argument versus the South have continued to compound.
Knight Frank's regional UK desk has flagged the Northwest as the most plausible candidate to lead the 2026 UK price-growth table, with mid-single-digit annual gains expected against a national median nearer to Savills expects 2% for the year.
The Supply-Side Constraint That Amplifies Everything
The supply-side picture in UK residential has tightened materially since 2022. New-build completions have fallen well short of the official 300,000-per-year target, with 2025 completions tracking nearer to 200,000 nationally. The structural under-supply is the amplifier on any demand-side recovery.
Savills' supply-side research and the Greater London Authority's housing statistics both flag the same constraint. The Greater London market specifically has seen new-build completions collapse below 20,000 against an estimated annual need of 66,000.
The combination of easing rates and tightening supply is the textbook setup for sustained price growth. Knight Frank's 2026 outlook sees this as the most plausible base case for the UK market over the next 24 months.
The Buyer Cohort Driving the Recovery
The cohort returning to the UK market is meaningfully different from the 2019 cohort. First-time buyers using shared-ownership and government-backed mortgage products have returned. The second-step mover cohort, which had been frozen out by the rate environment, is now re-entering.
International buyers, particularly the EU passport-portable cohort, continue to allocate.
The cohort that remains pulled back is the non-dom-affected London prime international buyer. That is a London-specific dynamic and does not affect the broader UK picture meaningfully.
FT Property and Bloomberg's London property desk have both flagged the cohort-rotation as the cleanest explanation for why the broader UK recovery is real while London prime continues to underperform.
The Tools Buyers Should Now Be Using
For buyers evaluating a UK property move, the disciplined toolkit includes the Rightmove and Nationwide indices, the Bank of England's rate-trajectory communications, the local-authority planning pipeline data, and the Knight Frank and Savills regional outlooks.
The brokerage network is now fully mobilised again after the 2022-2023 freeze. Knight Frank, Savills, Hamptons, Strutt and Parker, John D Wood and the long-tenured regional firms are all reporting meaningful step-ups in inquiry volume.
What This Means for Buyers
Buyers acting in the next 12 to 18 months will likely face a tighter market than the 2024-2025 period offered. The structural supply constraint plus the easing-cycle demand recovery is a combination that favours the buyer who acts before the recovery is fully priced.
For the regional UK picture, the Northwest cluster (Manchester, Liverpool, Leeds) offers the strongest combination of pricing momentum, supply discipline and infrastructure-led upside. For London, prime exposure remains a long-cycle hold rather than a tactical position given the non-dom and SDLT framework constraints.
For international buyers, the EU-passport cohort retains the cleanest path. Non-EU buyers should structure with explicit attention to the post-non-dom framework and the SDLT surcharge on additional dwellings. Knight Frank, Savills and Sotheby's International Realty's UK desks all have the network to navigate the structuring.
We last reviewed this analysis in May 2026.

Savvas Agathangelou
Savvas Agathangelou co-founded The Luxury Playbook and has spent years reporting from the prime postcodes the magazine covers — Mayfair, Knightsbridge, the Athens Riviera, Dubai's Palm crescents, and the southern Mediterranean coastlines where the world's wealthy keep coming back. His background is in international hospitality, and that frame shapes how he writes about property: the developer's choices, the architect's signature, the agency's bench of named brokers, the building's service standard once the buyer moves in. He files developer spotlights, agency profiles, and the seasonal "Properties That Defined" listicles, and he hosts the magazine's founder-and-leadership interviews on the Voices side.